Voolt
Role:
Sr Product Designer
Team:
Claudio Rocha (Jr Product Designer)
Contributions:
UX/UI Design
Visual Design
Data Analysis
Research
User Flow
Project Management
Project Overview:
Voolt empowers contractors to launch Google and Facebook ad campaigns effortlessly. The Design team of two handled from creating landing pages, setting up ads, and delivering leads phases of the tool.
Problem:
- Many users dropped off during onboarding.
- Users were confused about how they would be charged.
- Users lacked clarity on what their ads would look like.
- There was minimal trust in the process due to lack of transparency and personalization early on.
Disclaimer: data has been modified as a measure to protect confidential information.

My goal as a Product Designer is to translate strategy into designs that are simple, easy to use and solve a problem.
Leading the Interface and Strategy for a feature from scratch
The primary users—plumbers, roofers, and lawn care professionals—were not tech-savvy, so the challenge was to make the setup process simple and intuitive.
The business needed to build the product from scratch and determine the best way to ask users for essential information without disrupting their experience.
How to do research when there is no time to do so?
As a Product Designer, it's important to balance when to focus on research and when to move forward with design.
We had to balance depth of research with speed of delivery. We couldn't spend months on discovery, but we also couldn't guess.
What this means:
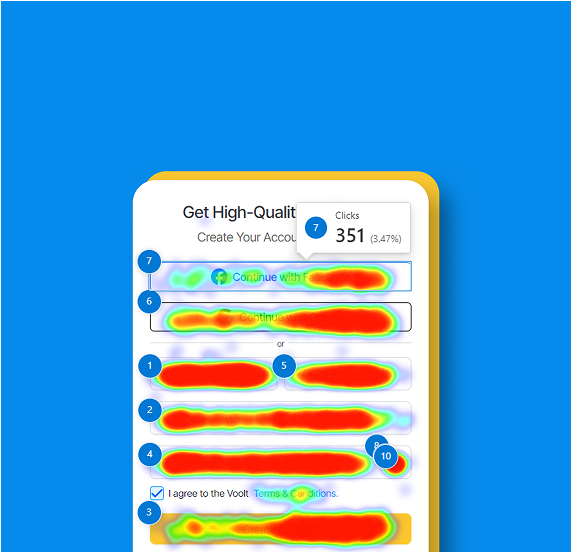
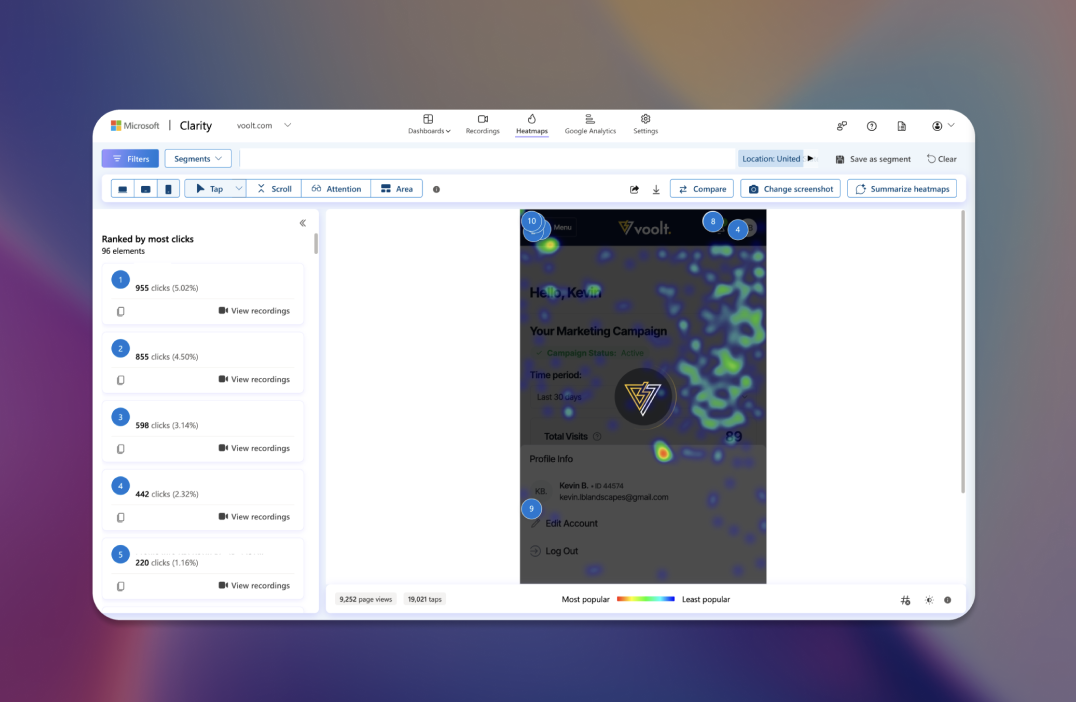
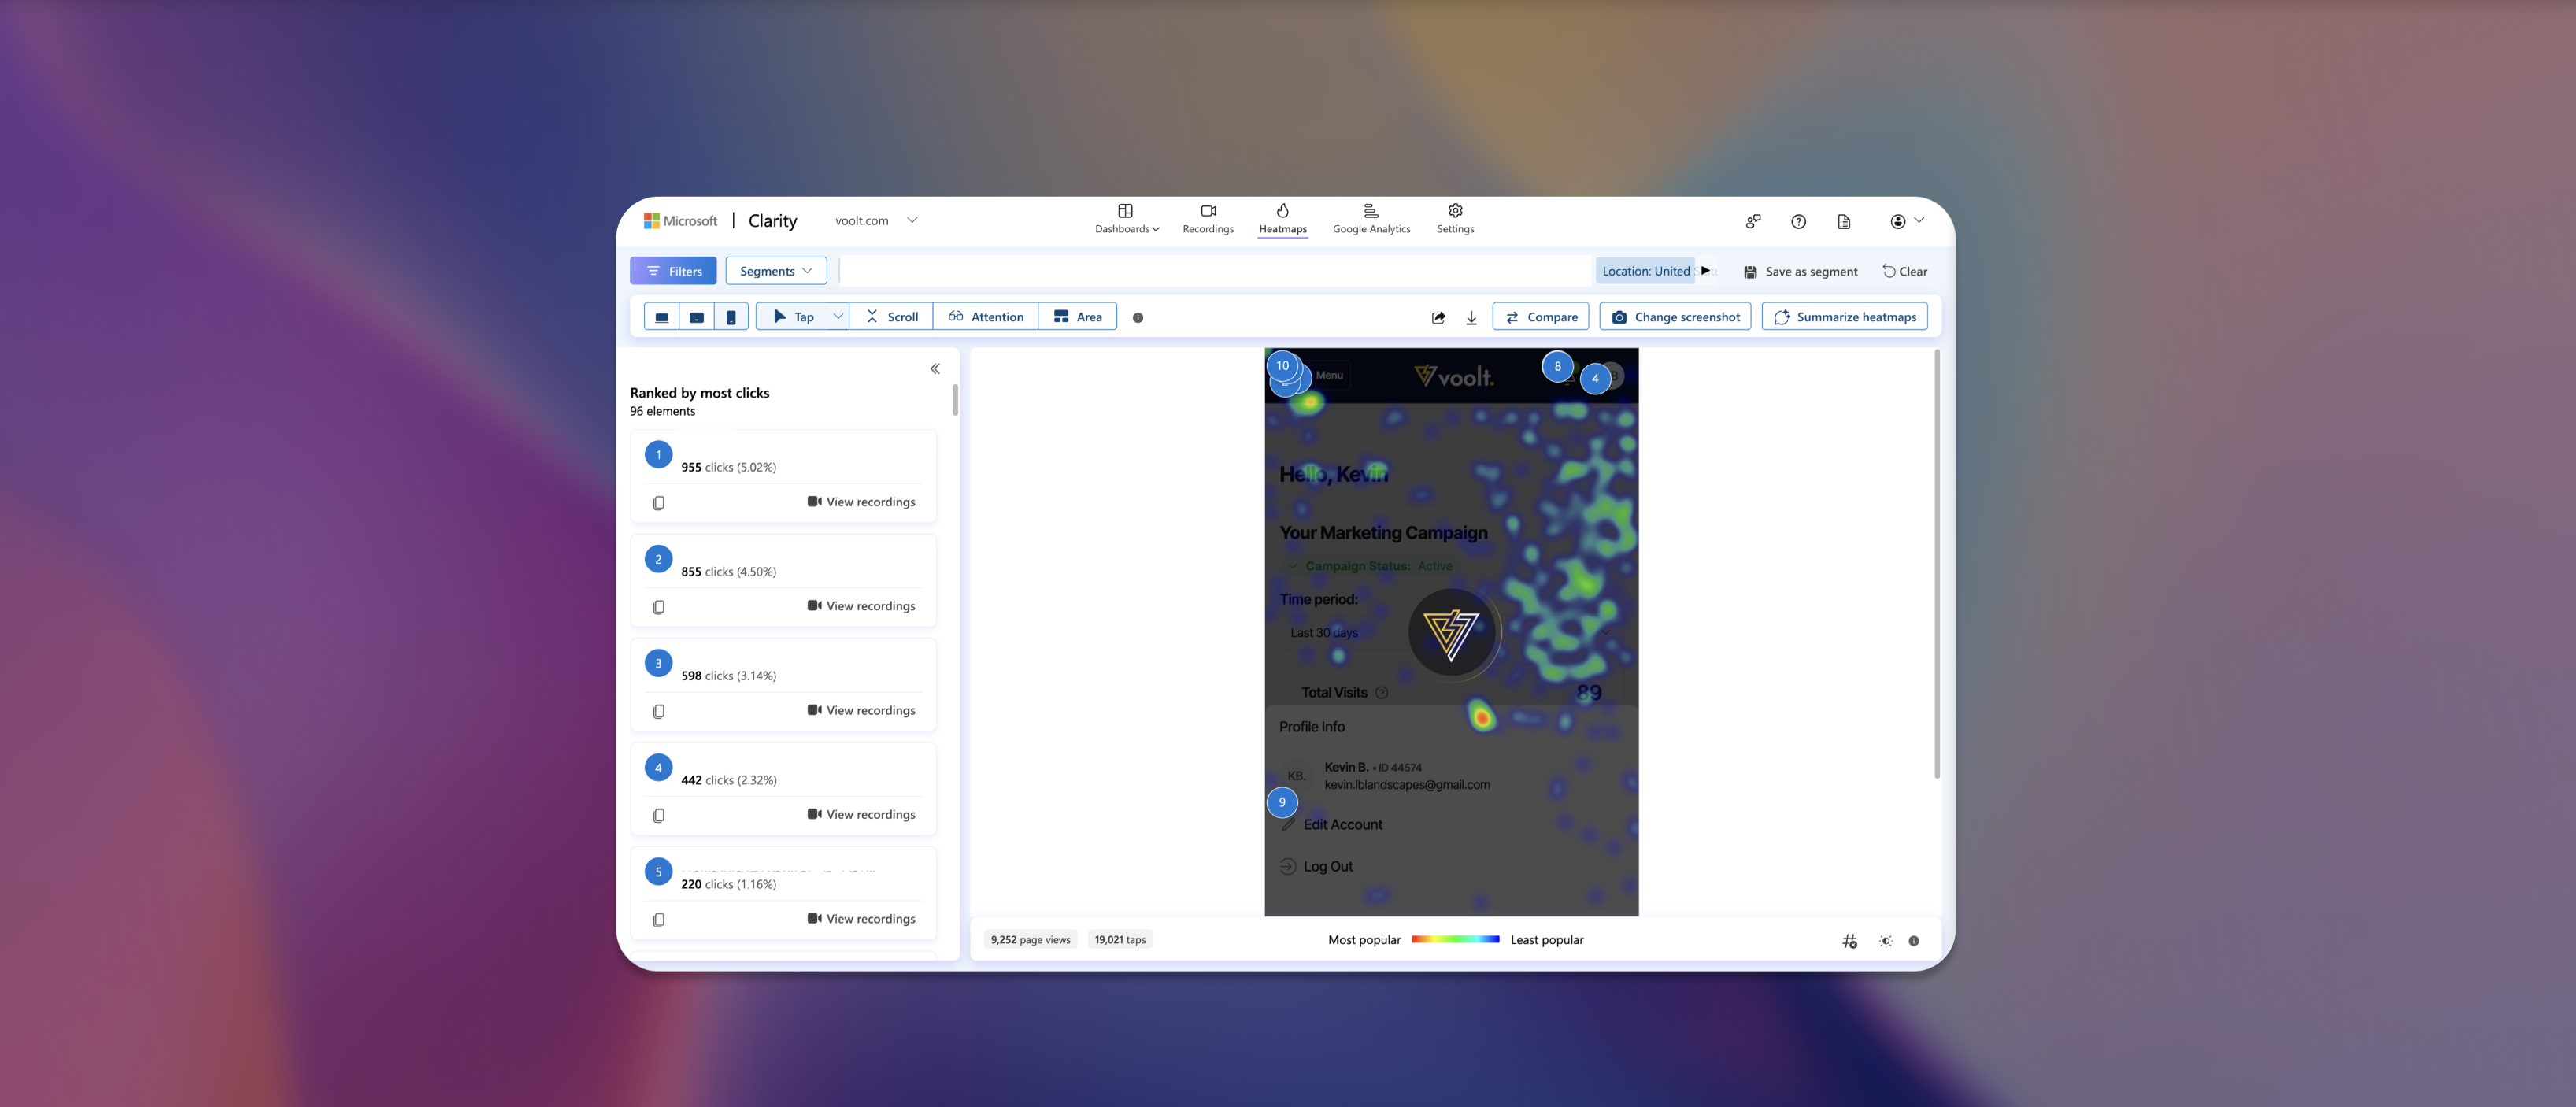
- Heatmaps and session recordings from Clarity showed where users hesitated or abandoned
- Google Analytics and Mixpanel confirmed drop-off patterns and identified which steps bled the most users
- Support ticket analysis revealed the emotional story behind the data
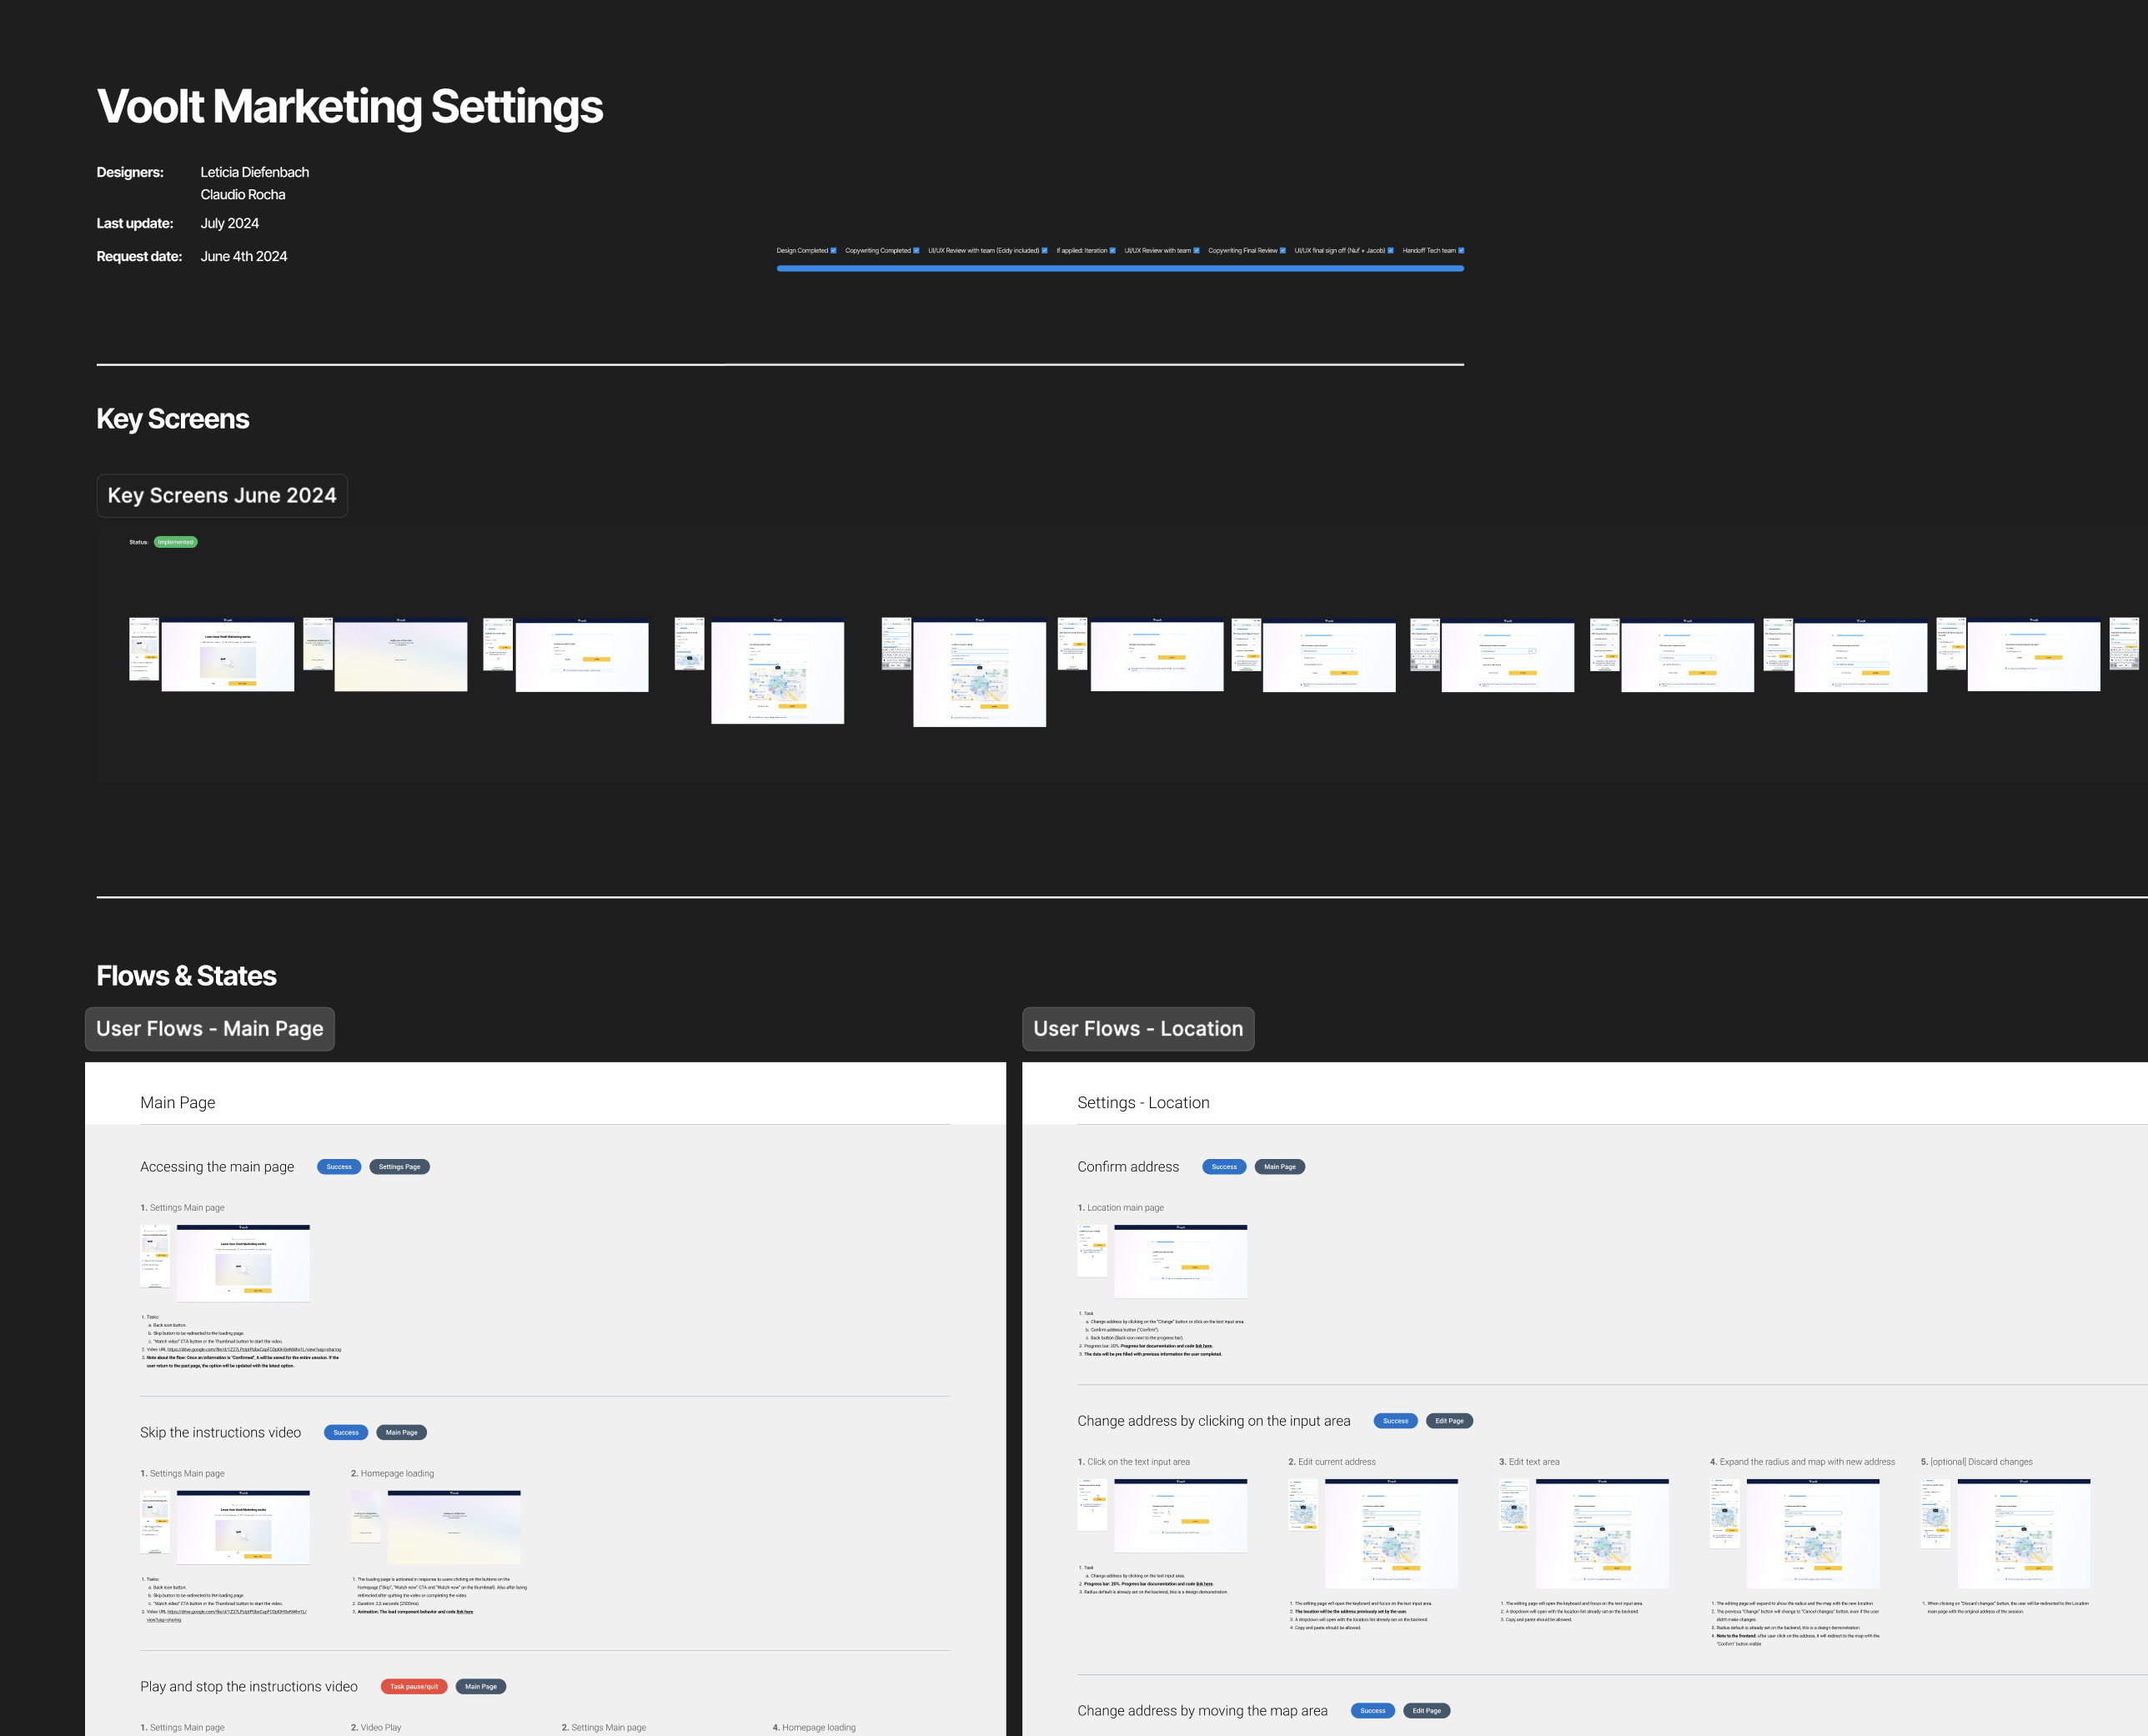
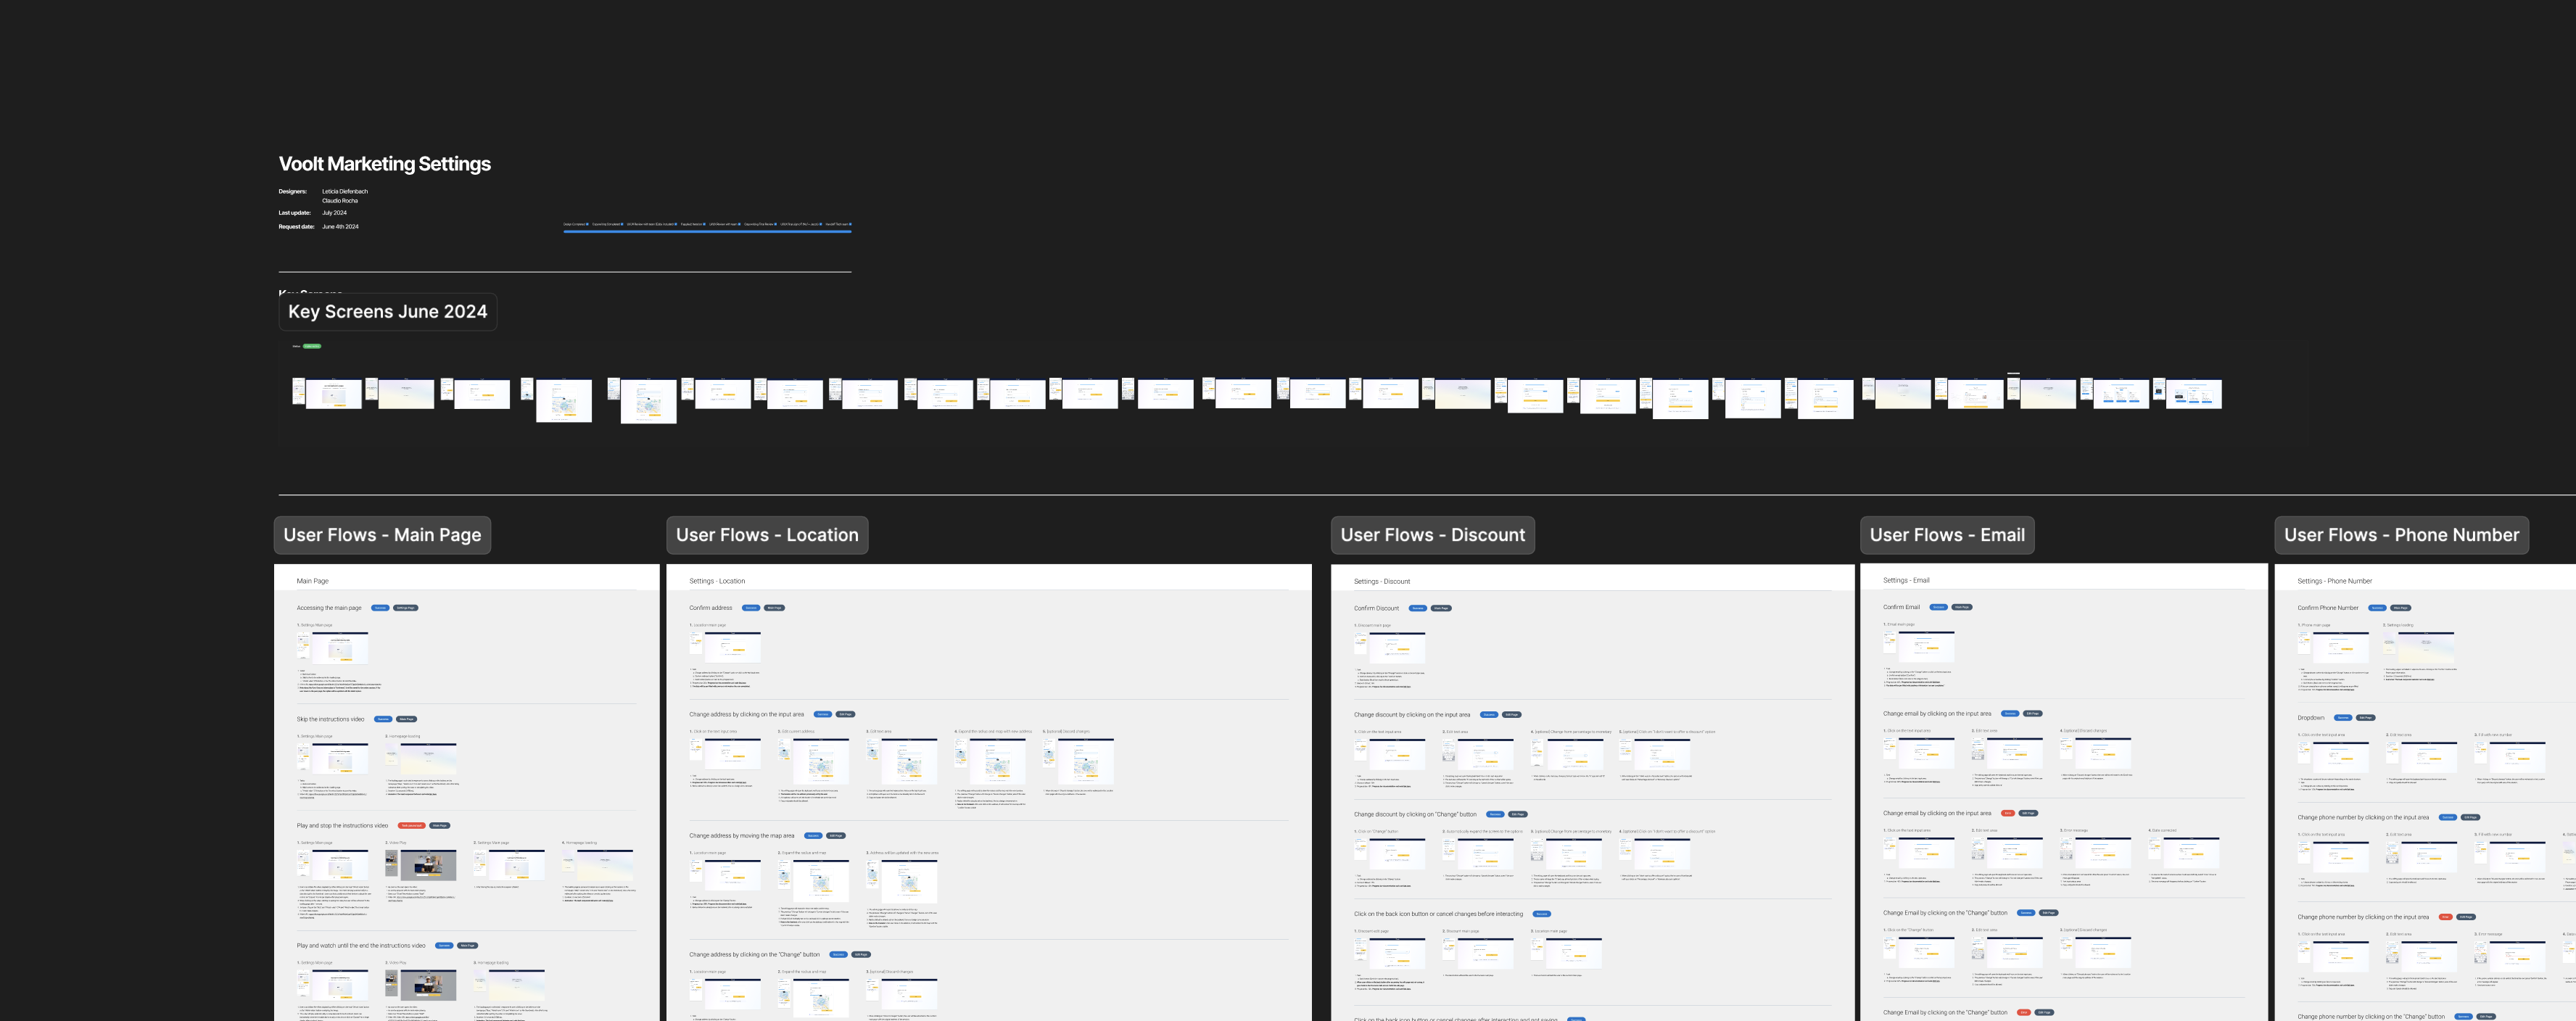
Figma organization
The top priority for the development team was having a well-organized Figma file, so I adapted the workflow I had used at Dell to meet their needs.Working with a team of two designers and three frontend developers, I implemented a streamlined design process and clear documentation—ensuring we worked smarter, not slower.
The Solution: Show, Don't Just Tell
We rebuilt the onboarding experience around clarity, visual feedback, and gradual education.
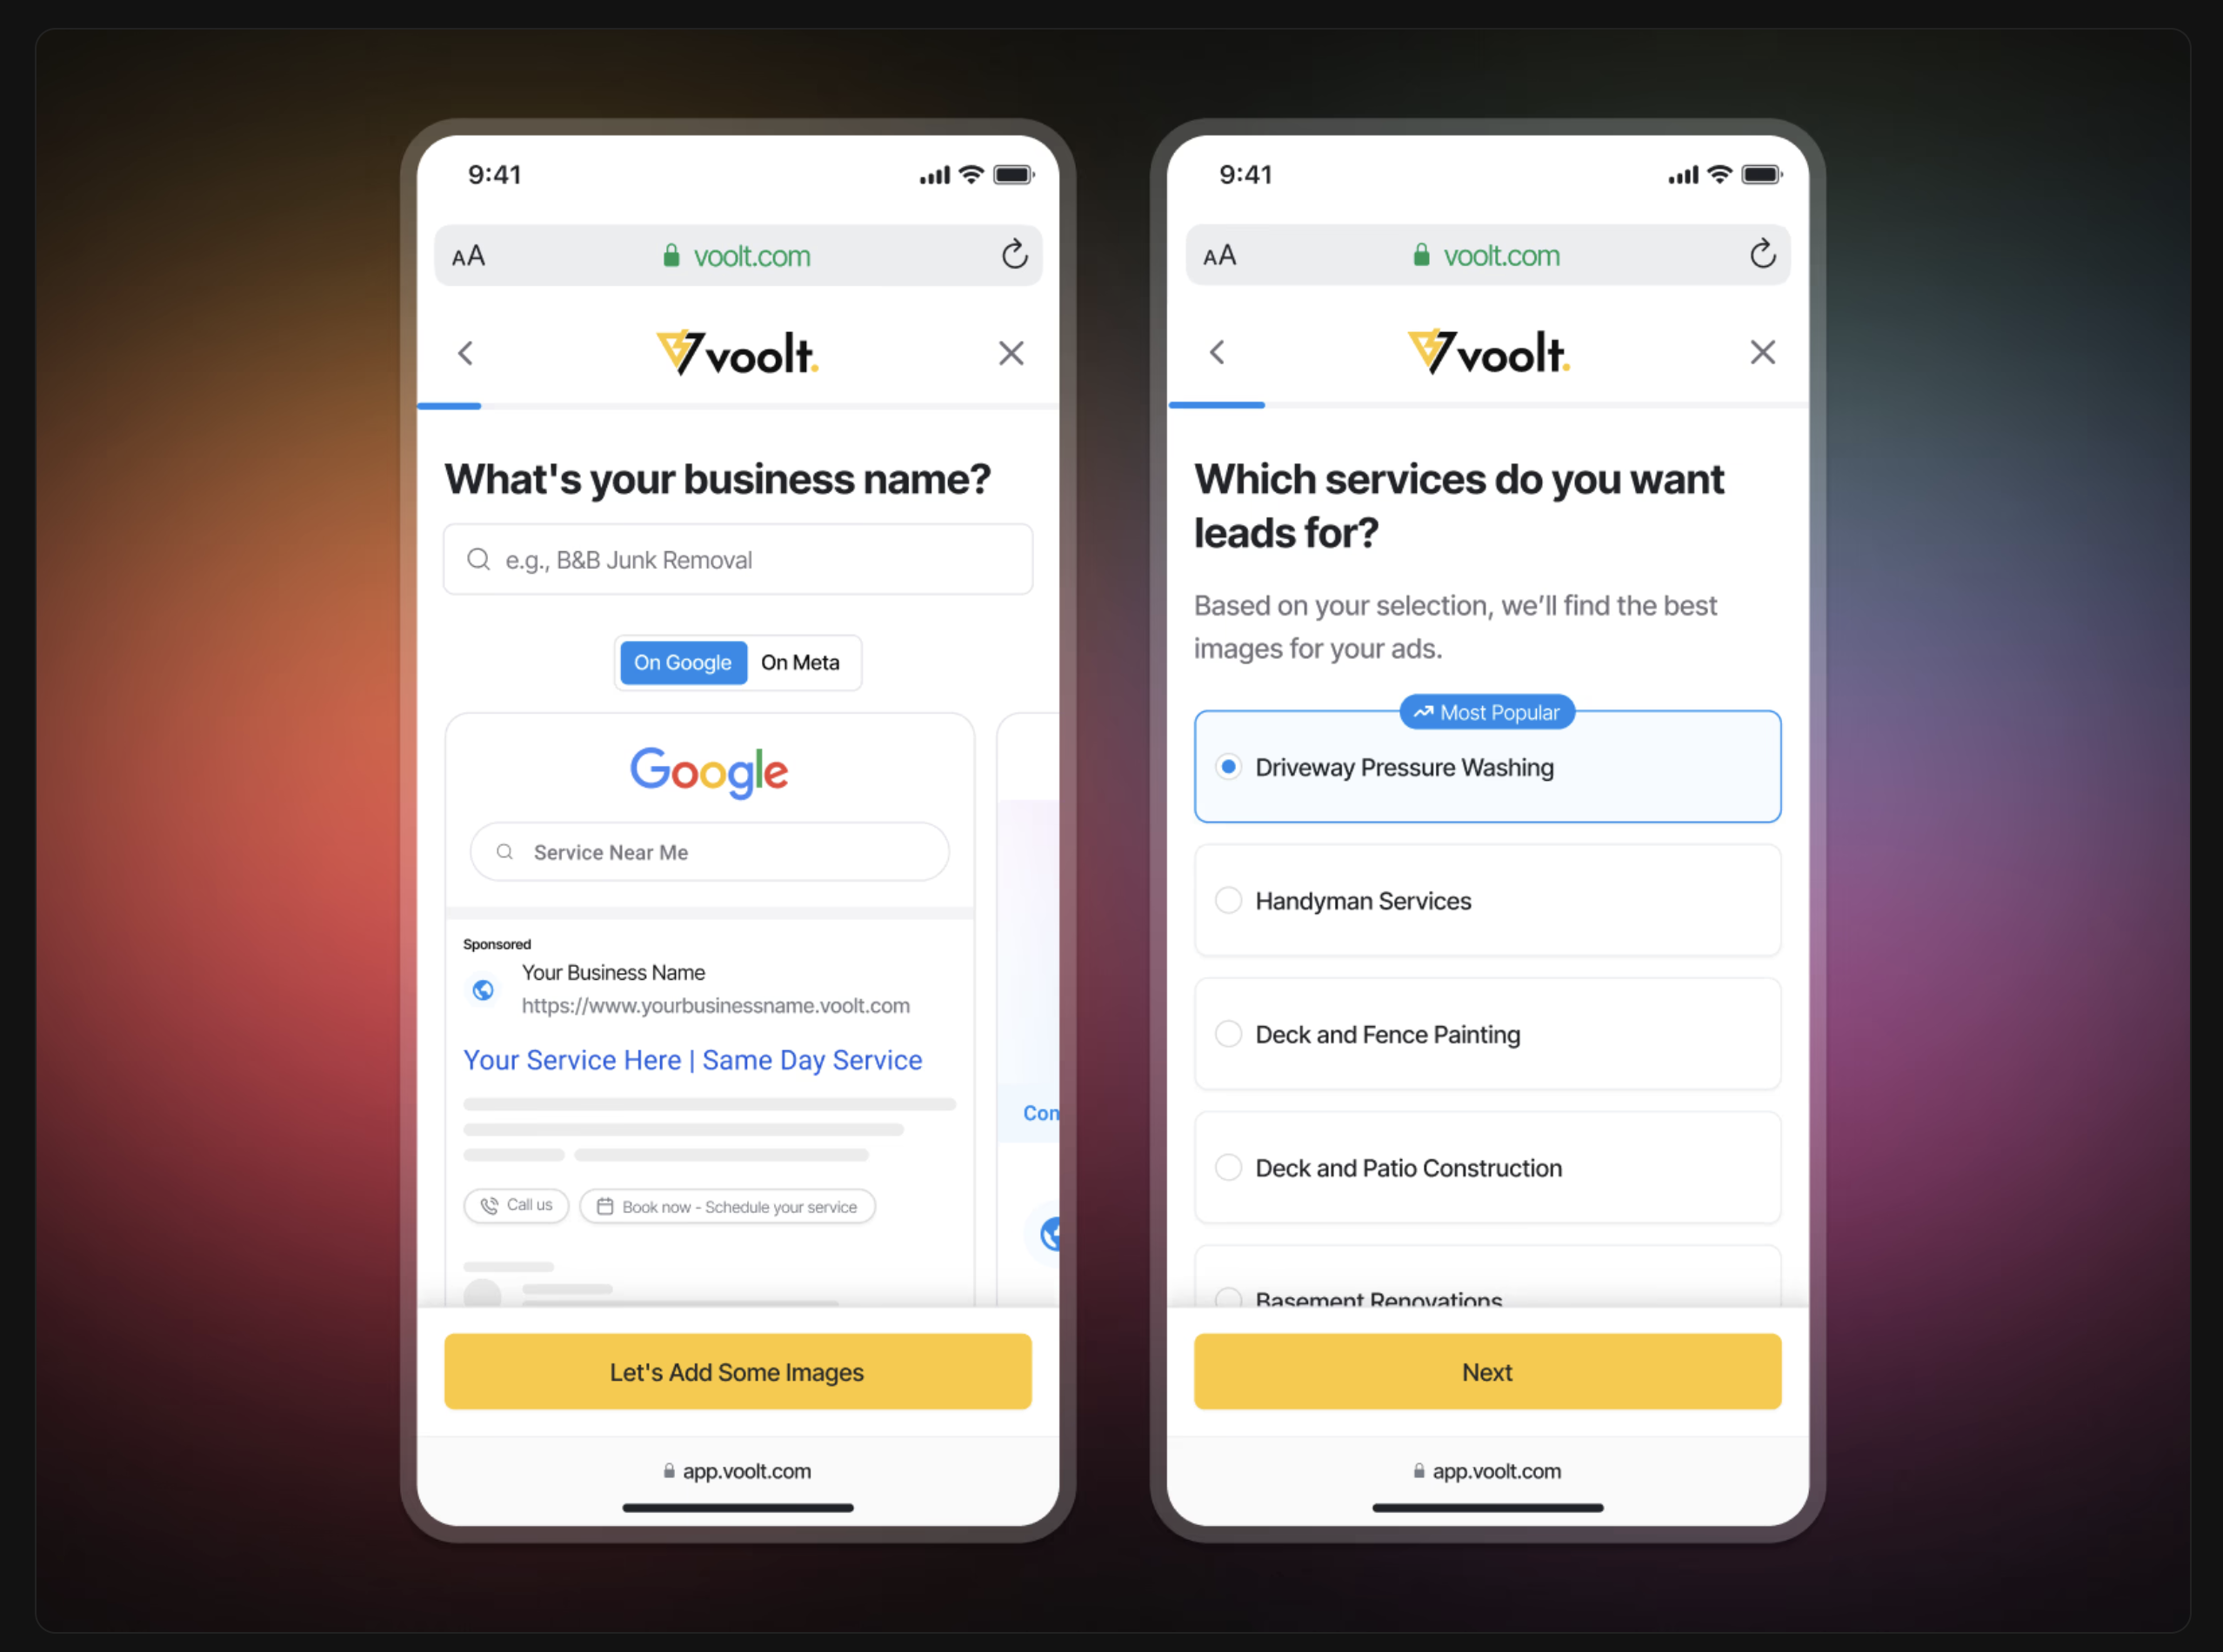
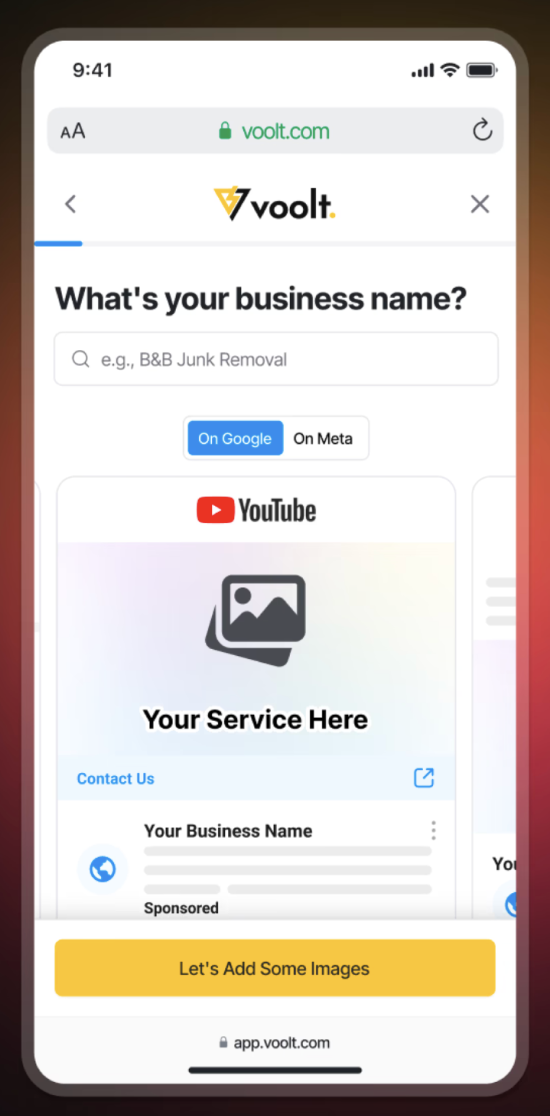
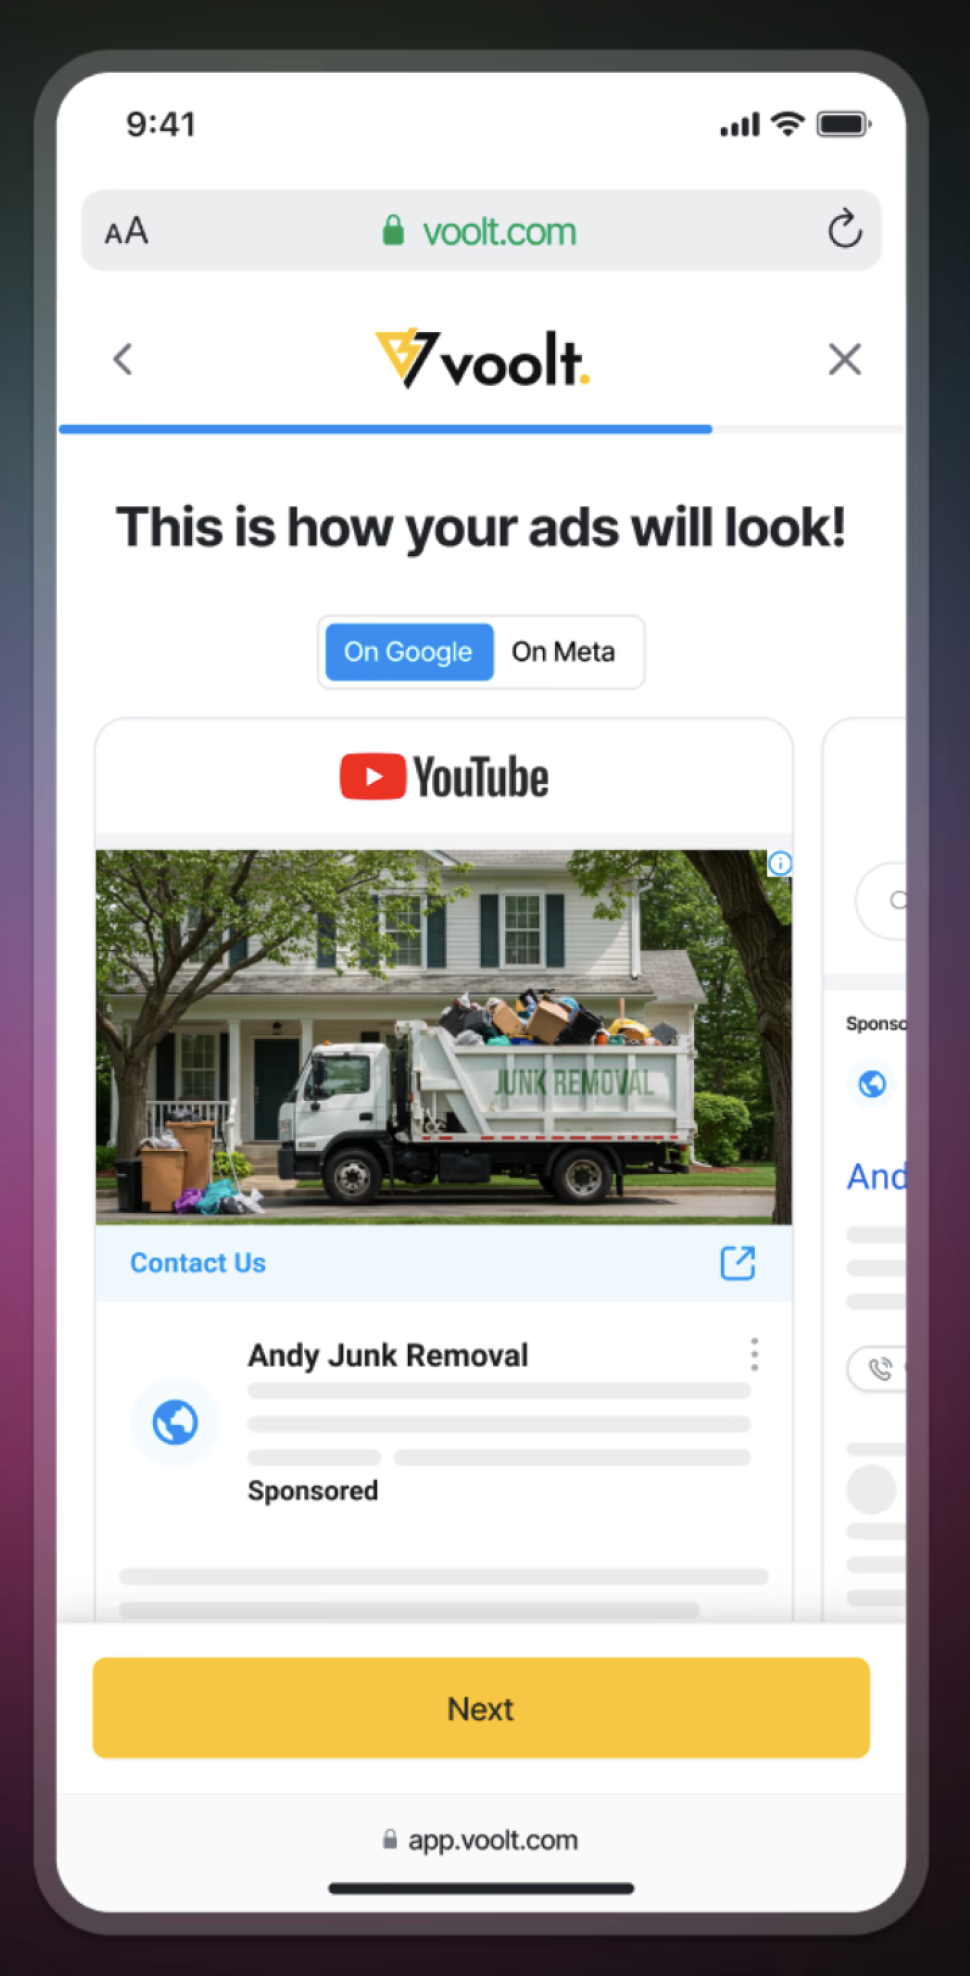
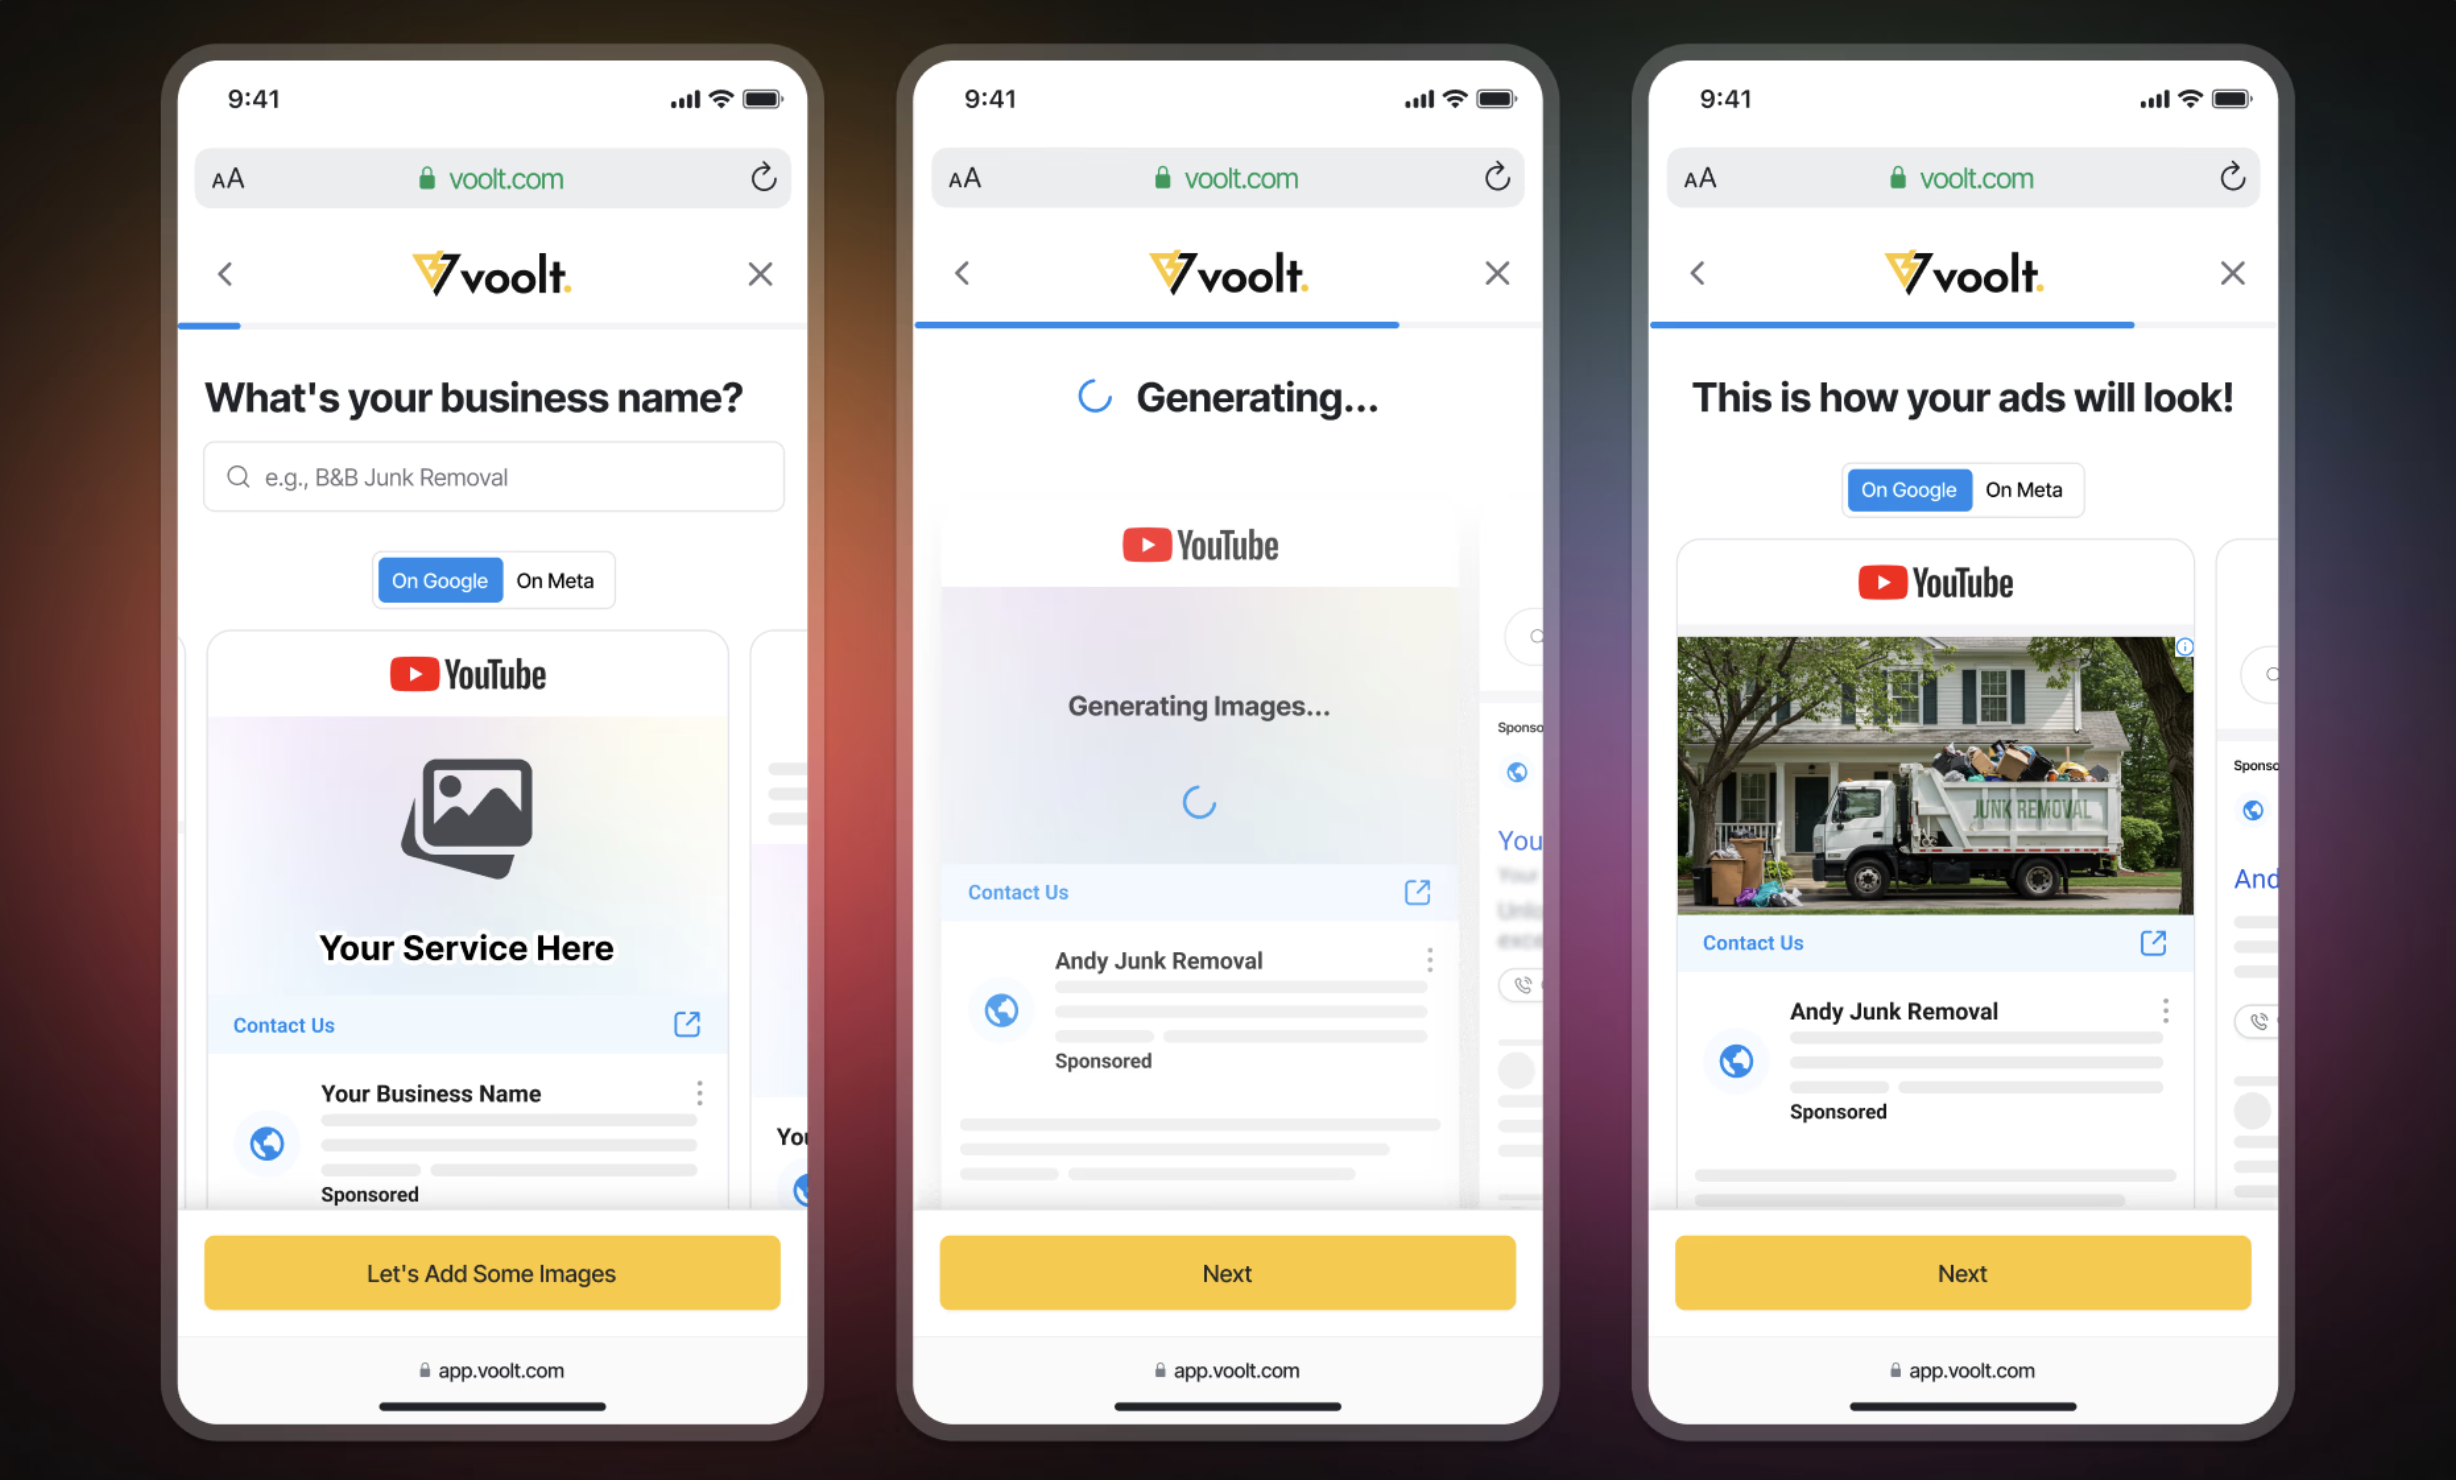
1.Interactive Ad Previews
As users input their business information, live ad previews update dynamically. Real images are added based on their industry. The more they fill out, the more personalized it becomes.
Why it matters:
Users see their investment taking shape in real time.
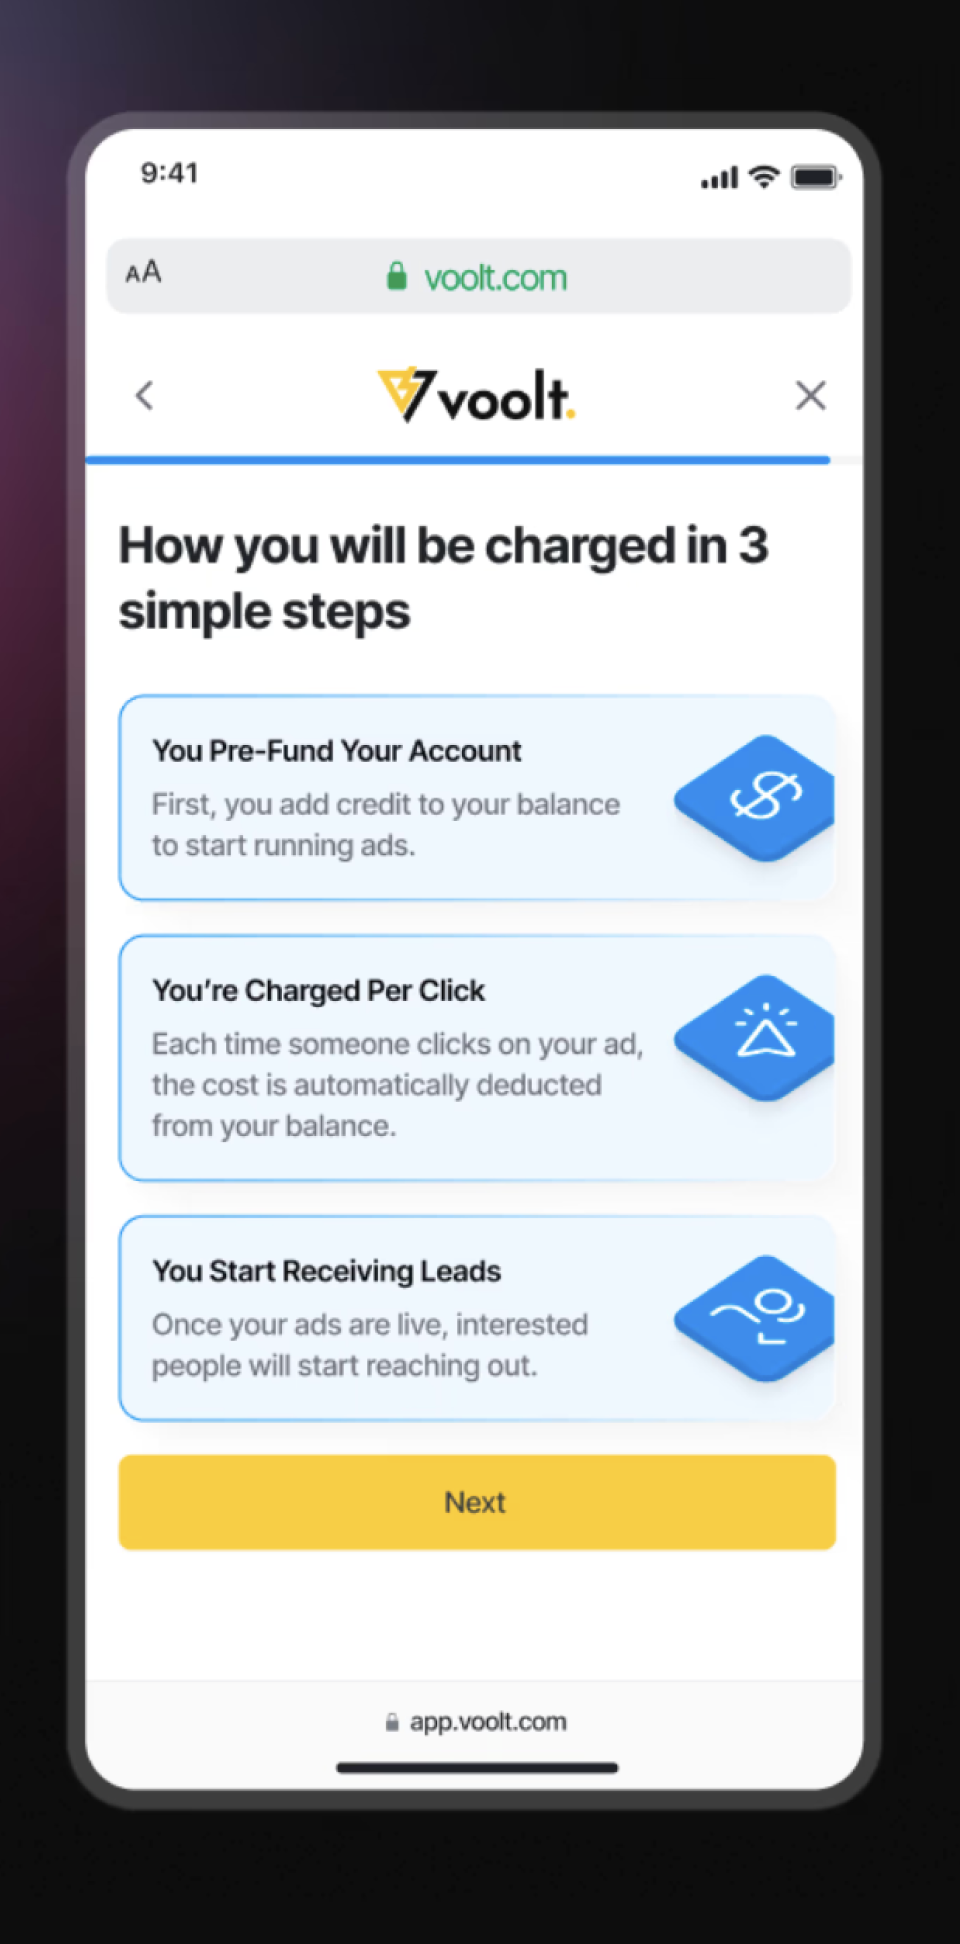
2. Micro-Education Moments
We placed short, digestible explanations at critical decision points:
- How location targeting works
- Where leads will be sent
- How billing and deposits function
2. Micro-Education Moments
We placed short, digestible explanations at critical decision points:
- How location targeting works
- Where leads will be sent
- How billing and deposits function
The Results: Quality Over Quantity
Three months after the product was launched:
67%
Still active after 30 days
Average 192 of 288 users after 30 days
46%
Still active after 90 days
Average 132 of 288 users after 3 months

2026 | Made via Figma Sites by Leticia Diefenbach

Voolt
Role:
Sr Product Designer
Additional team member:
Claudio Rocha (Jr Product Designer)
Contributions:
UX/UI Design
Visual Design
Data Analysis
Research
User Flow
Project Management
Project Overview:
Voolt empowers contractors to launch Google and Facebook ad campaigns effortlessly. The Design team of two handled from creating landing pages, setting up ads, and delivering leads phases of the tool.
Problem:
- Many users dropped off during onboarding.
- Users were confused about how they would be charged.
- Users lacked clarity on what their ads would look like.
- There was minimal trust in the process due to lack of transparency and personalization early on.
Disclaimer: data has been modified as a measure to protect confidential information.

My goal as a Product Designer is to translate strategy into designs that are simple, easy to use and solve a problem.
Leading the Interface & Strategy from scratch
The primary users—plumbers, roofers, and lawn care professionals—were not tech-savvy, so the challenge was to make the setup process simple and intuitive.
The business needed to build the product from scratch and determine the best way to ask users for essential information without disrupting their experience.
How to do research when there is no time to do so?
As a Product Designer, it's important to balance when to focus on research and when to move forward with design.
We had to balance depth of research with speed of delivery. We couldn't spend months on discovery, but we also couldn't guess.
What this means:
- Heatmaps and session recordings from Clarity showed where users hesitated or abandoned
- Google Analytics and Mixpanel confirmed drop-off patterns and identified which steps bled the most users
- Support ticket analysis revealed the emotional story behind the data
Figma organization
The top priority for the development team was having a well-organized Figma file, so I adapted the workflow I had used at Dell to meet their needs.Working with a team of two designers and three frontend developers, I implemented a streamlined design process and clear documentation—ensuring we worked smarter, not slower.
The Solution: Show, Don't Just Tell
We rebuilt the onboarding experience around clarity, visual feedback, and gradual education.
1.Interactive Ad Previews
As users input their business information, live ad previews update dynamically. Real images are added based on their industry. The more they fill out, the more personalized it becomes.
Why it matters:
Users see their investment taking shape in real time.
2. Micro-Education Moments
We placed short, digestible explanations at critical decision points:
- How location targeting works
- Where leads will be sent
- How billing and deposits function
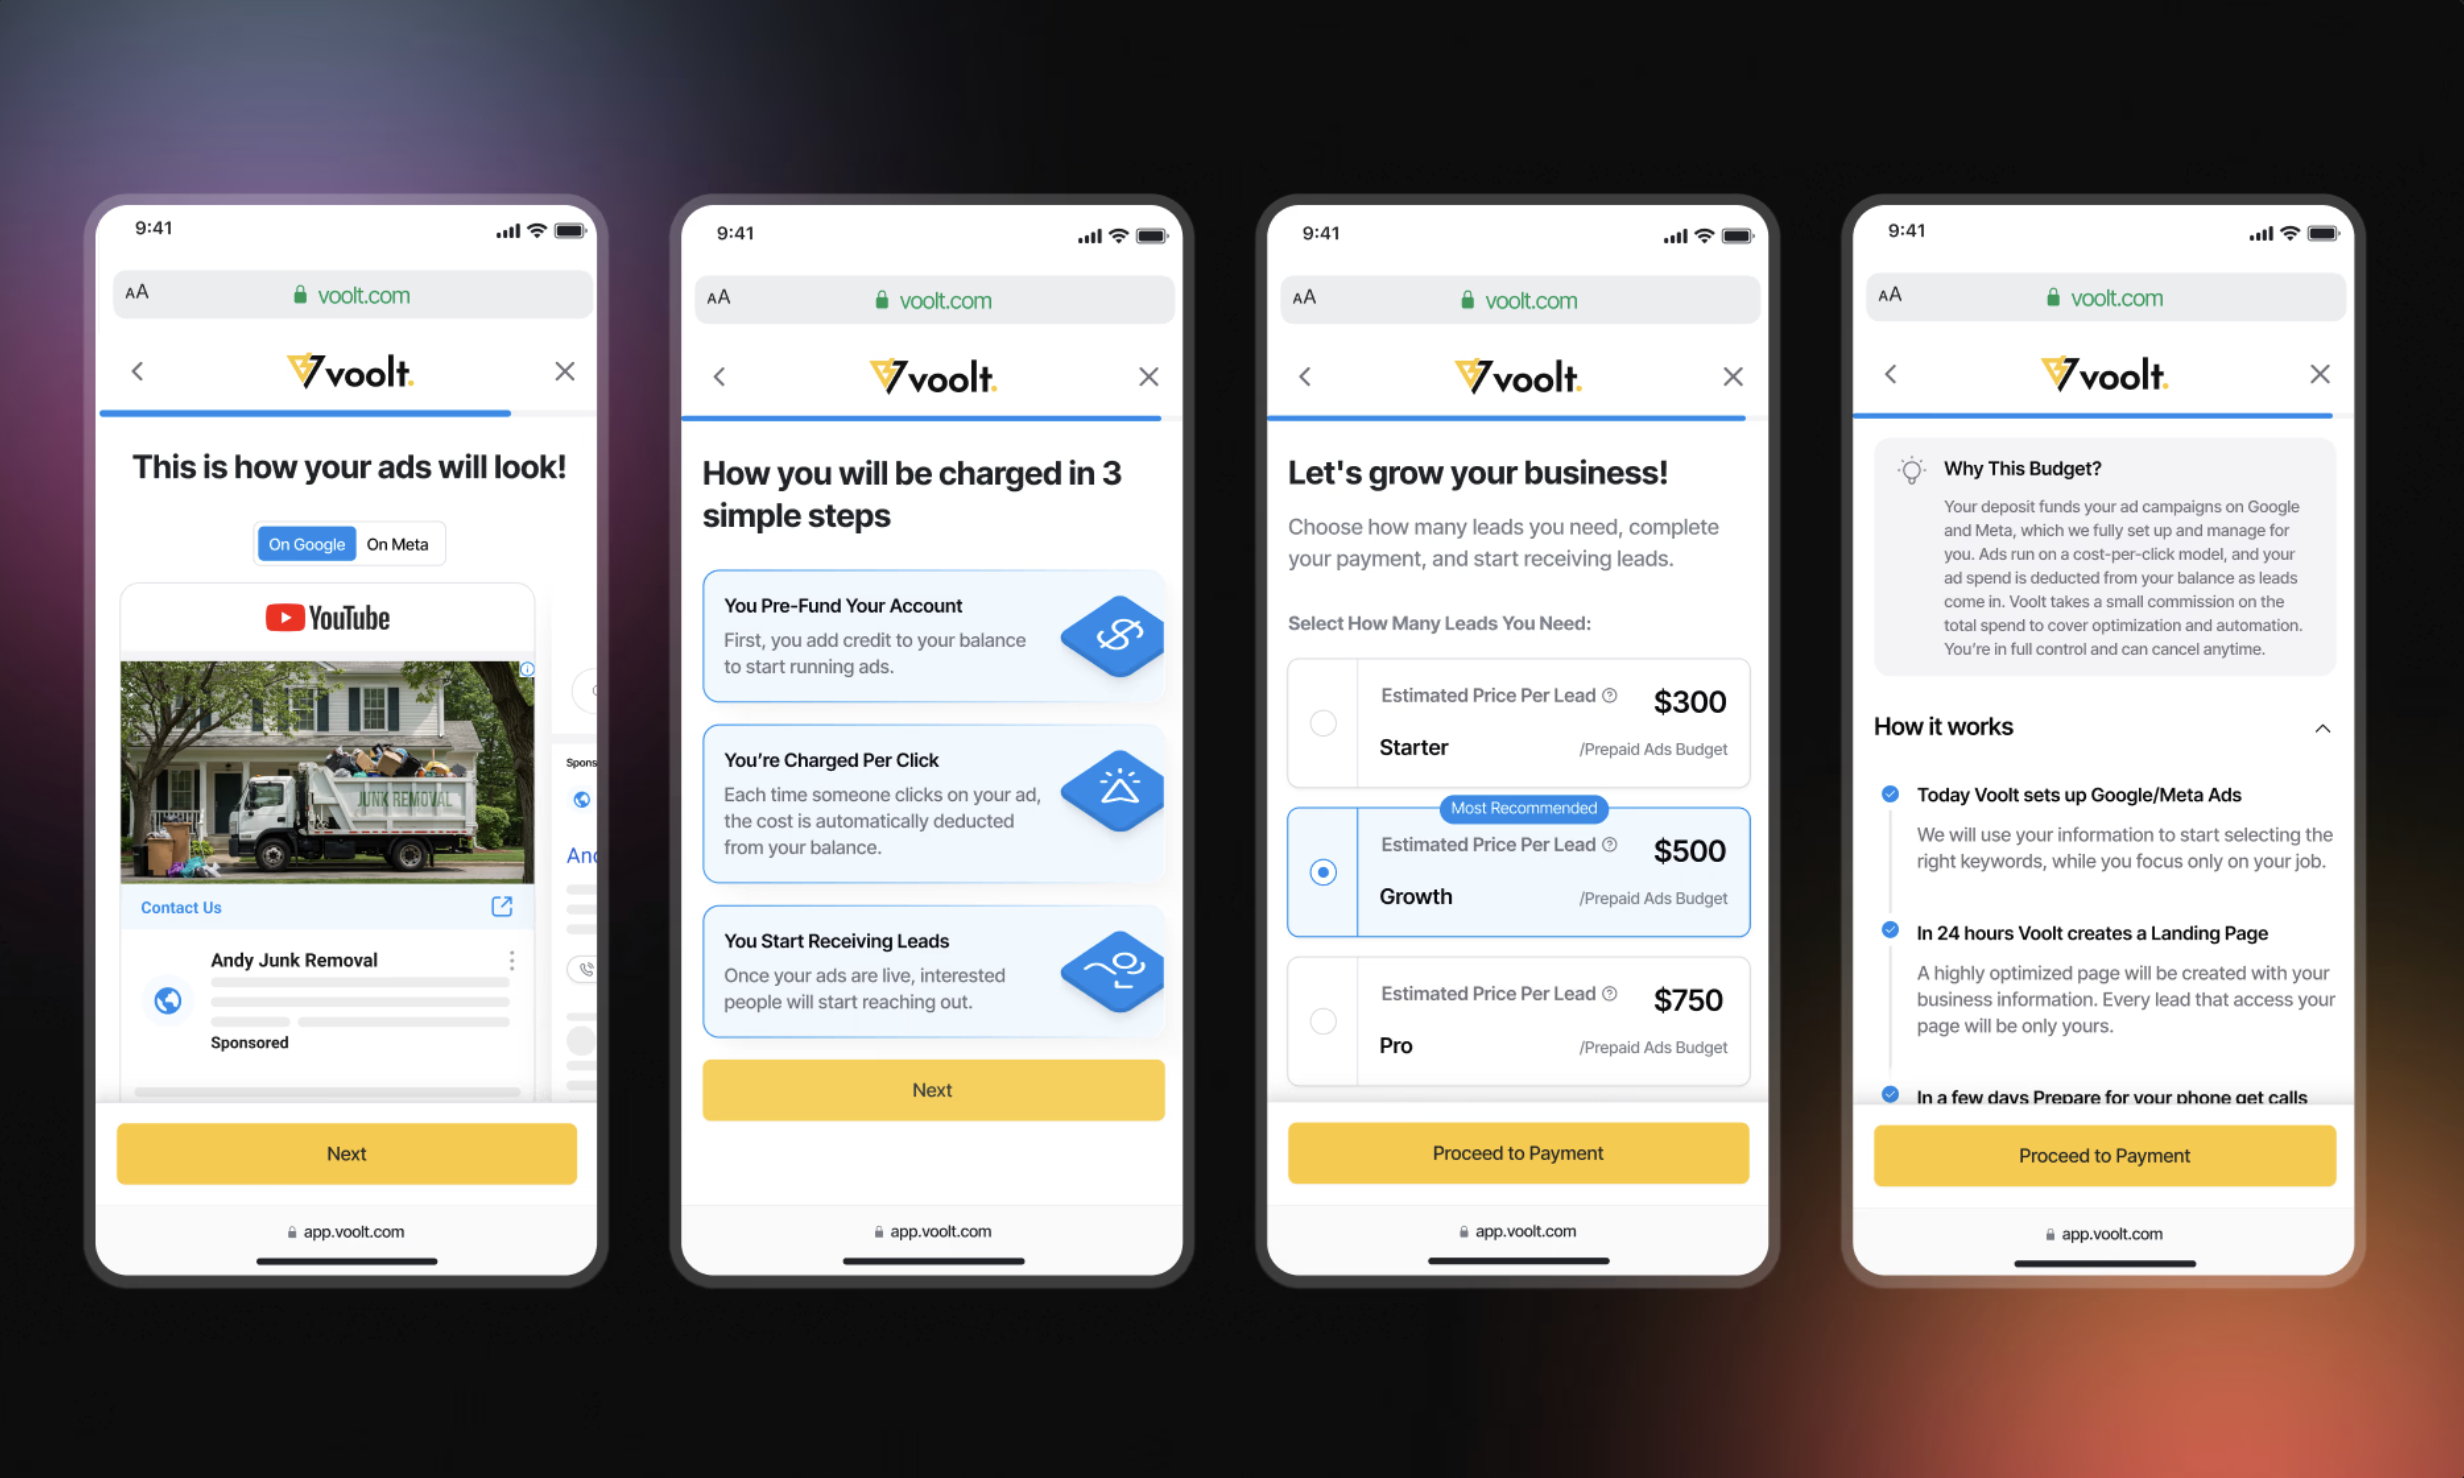
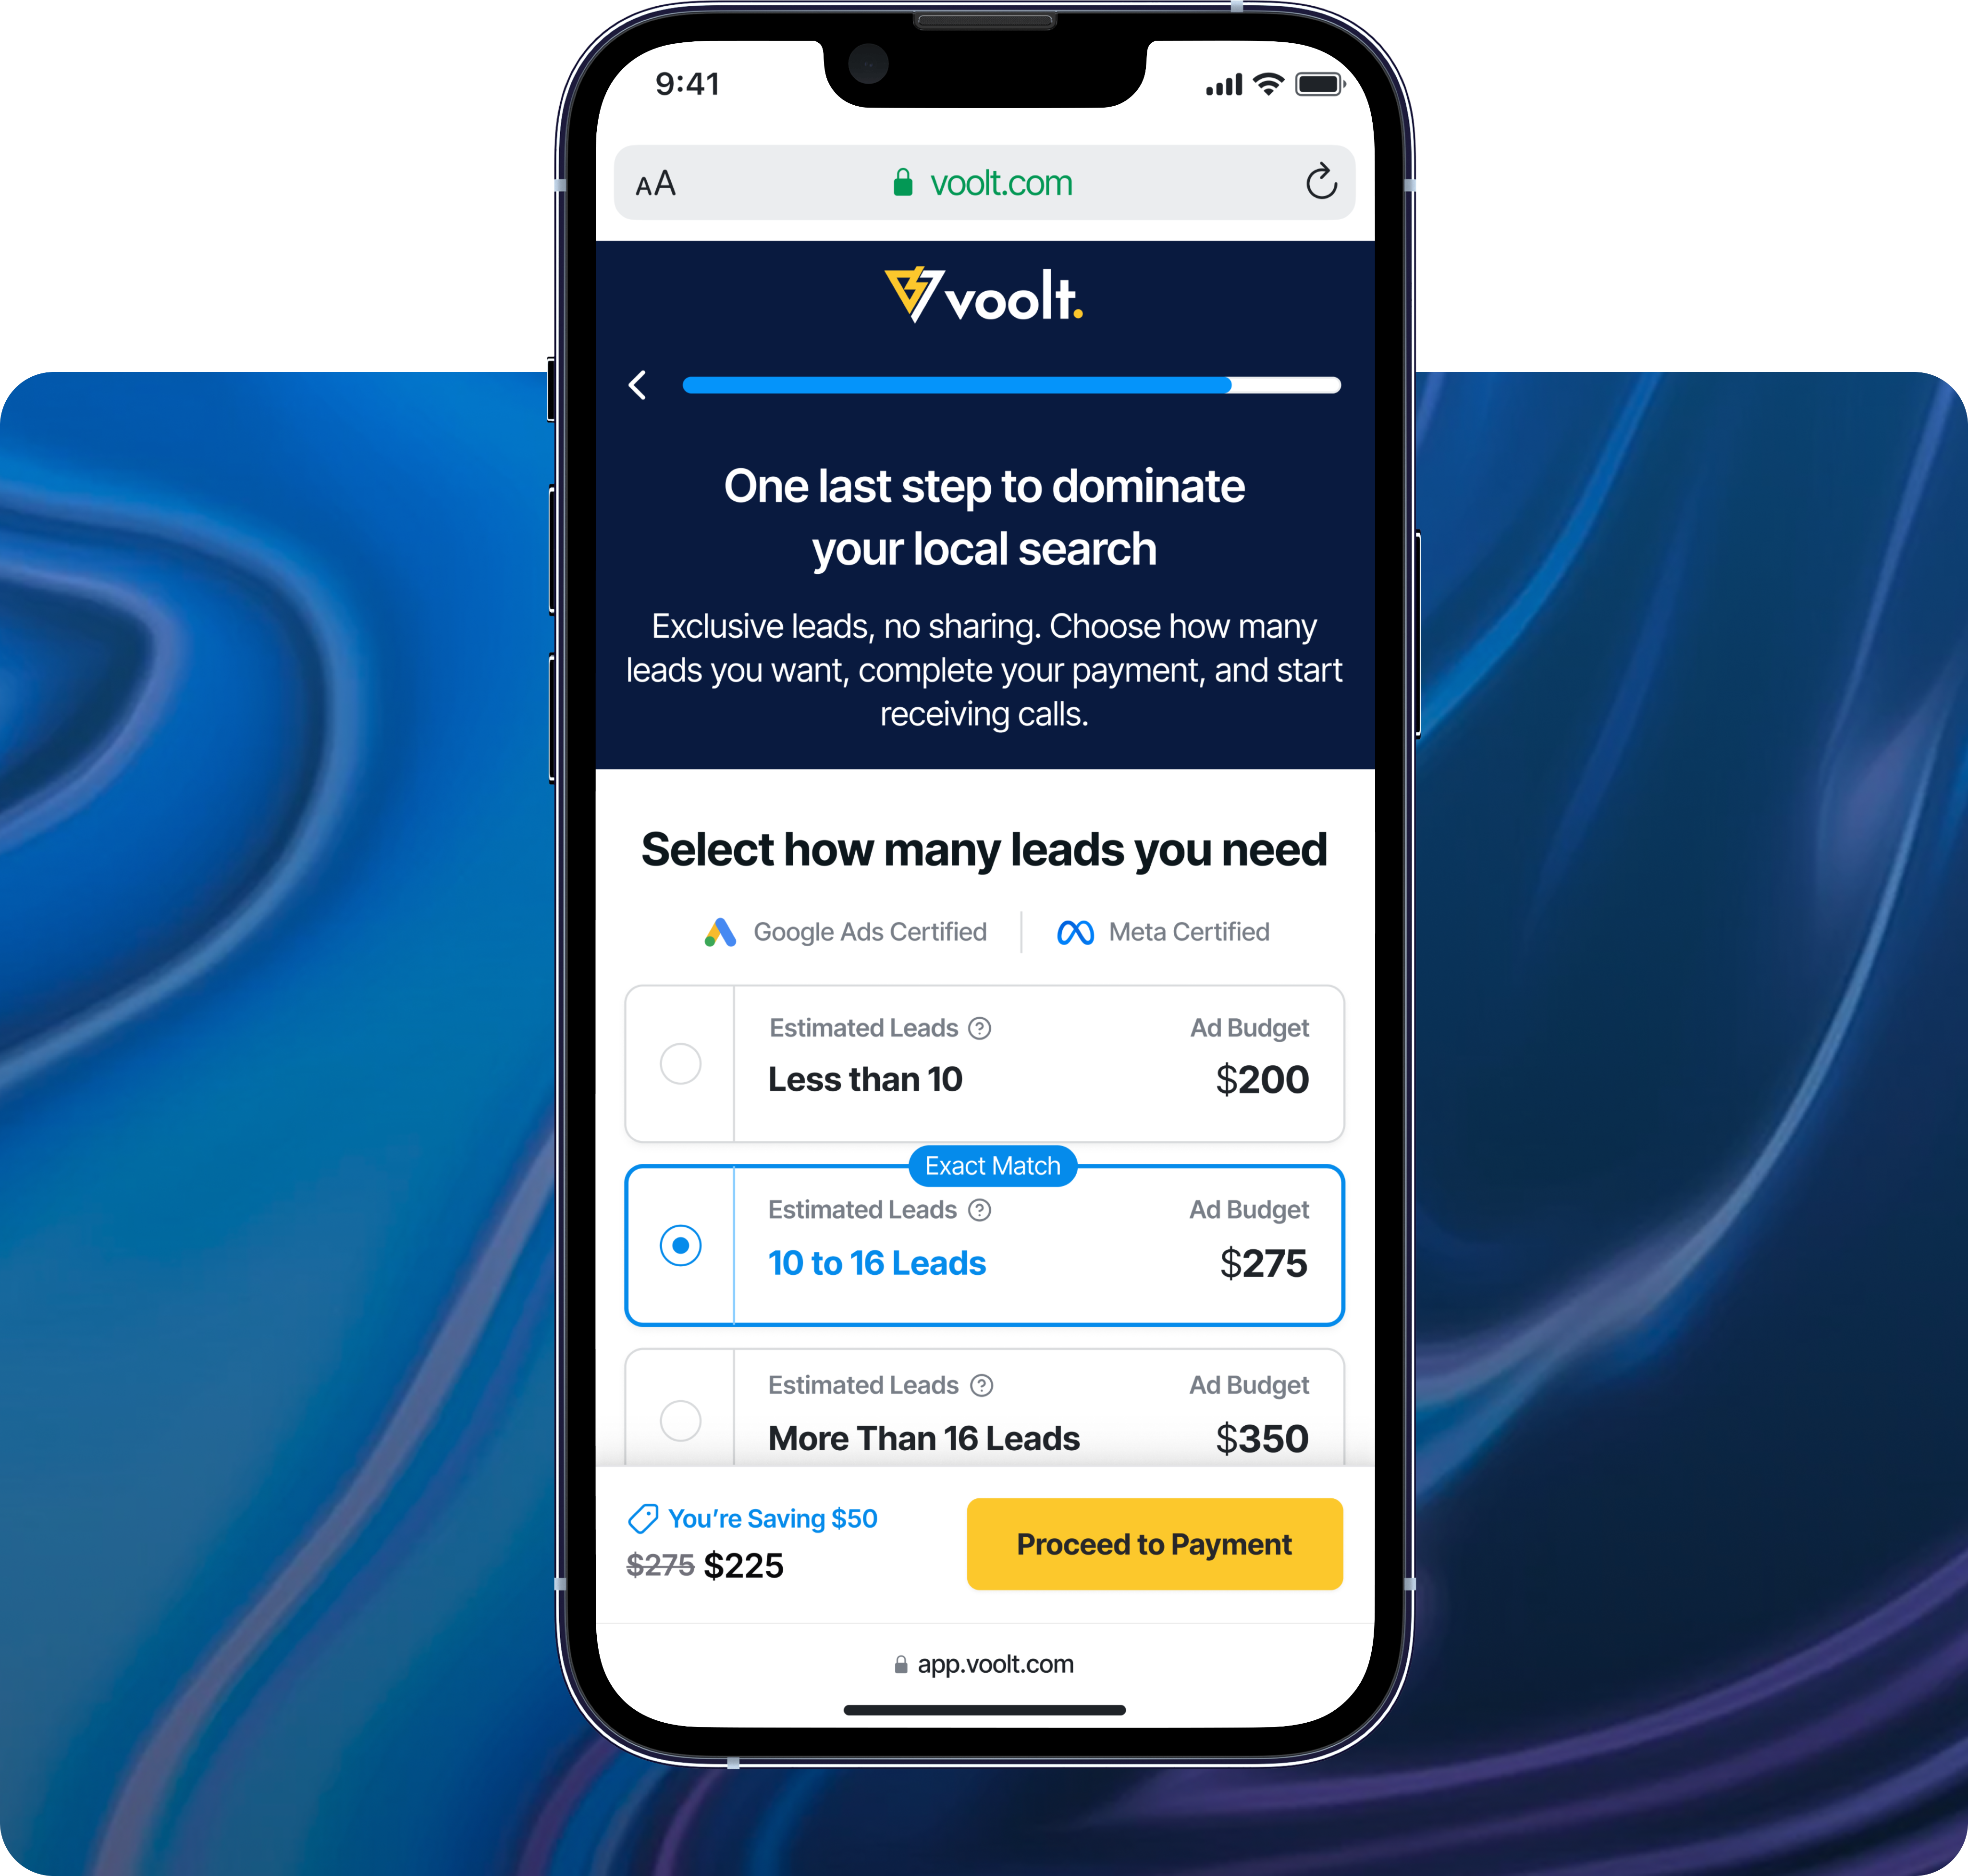
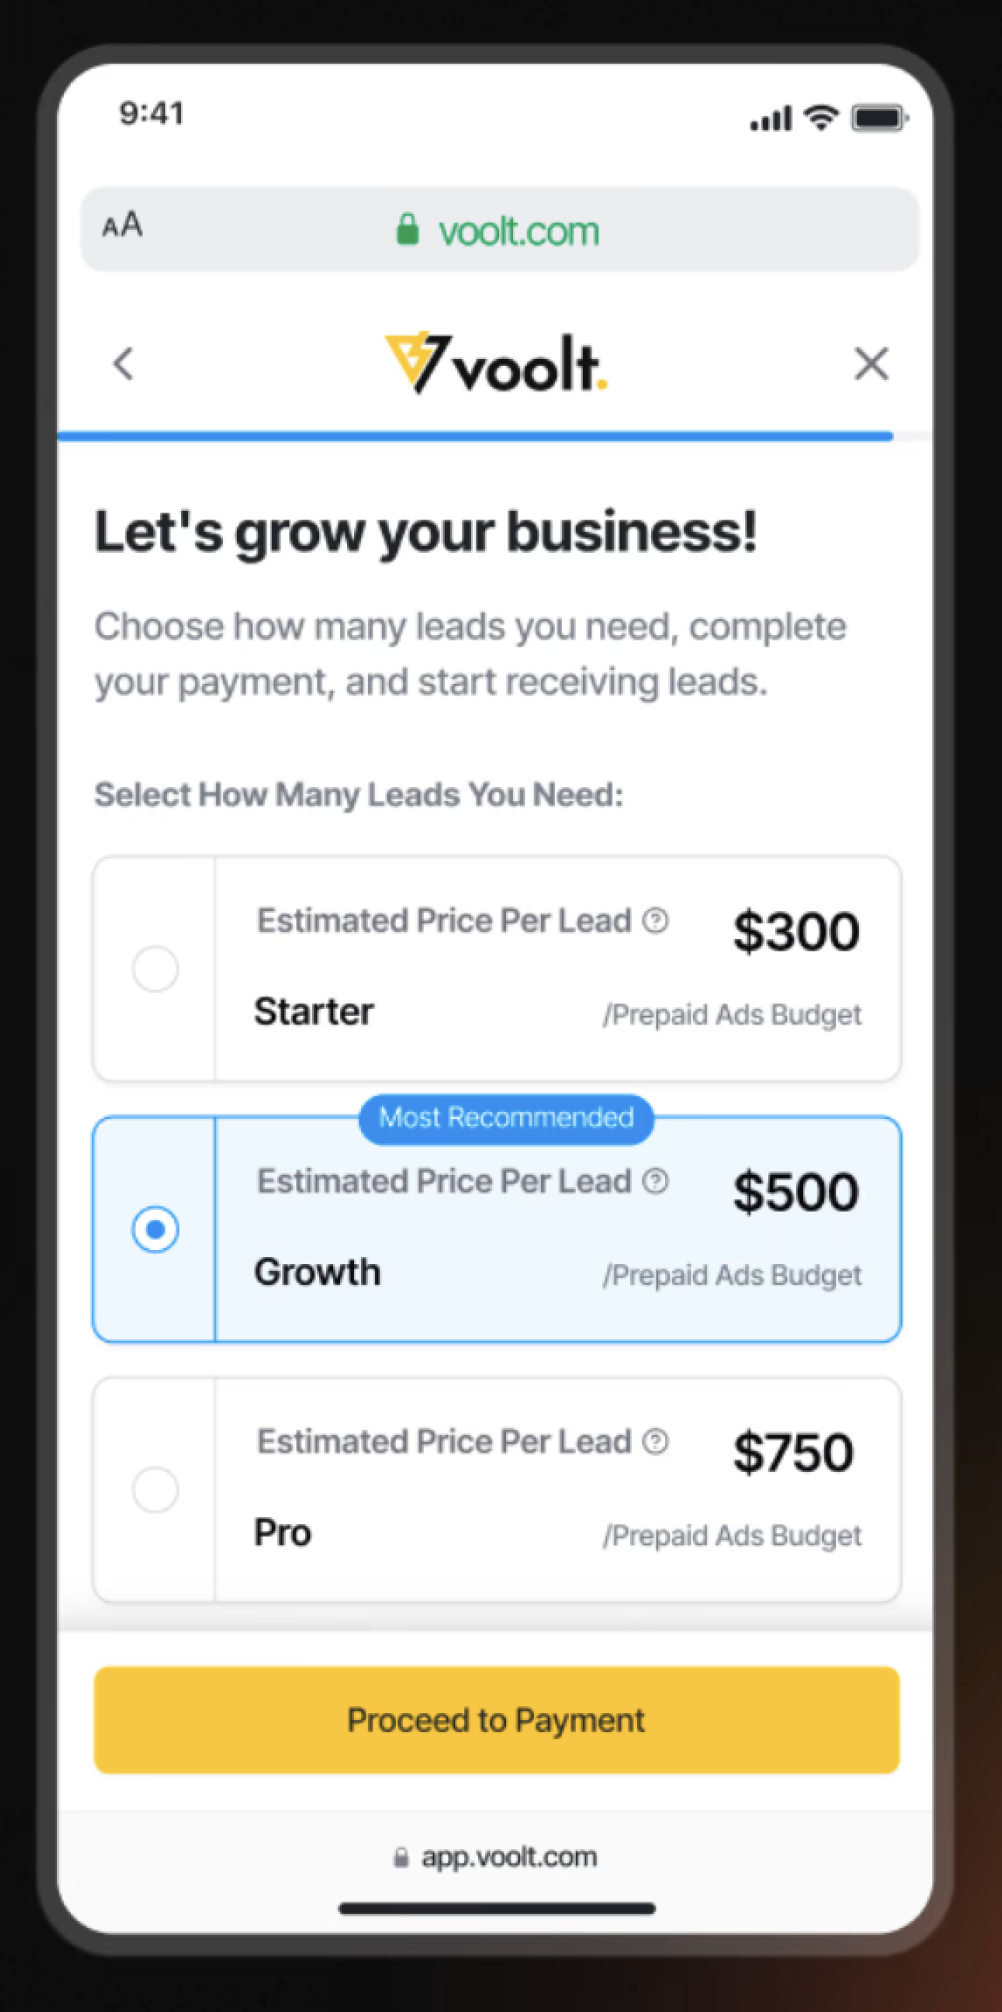
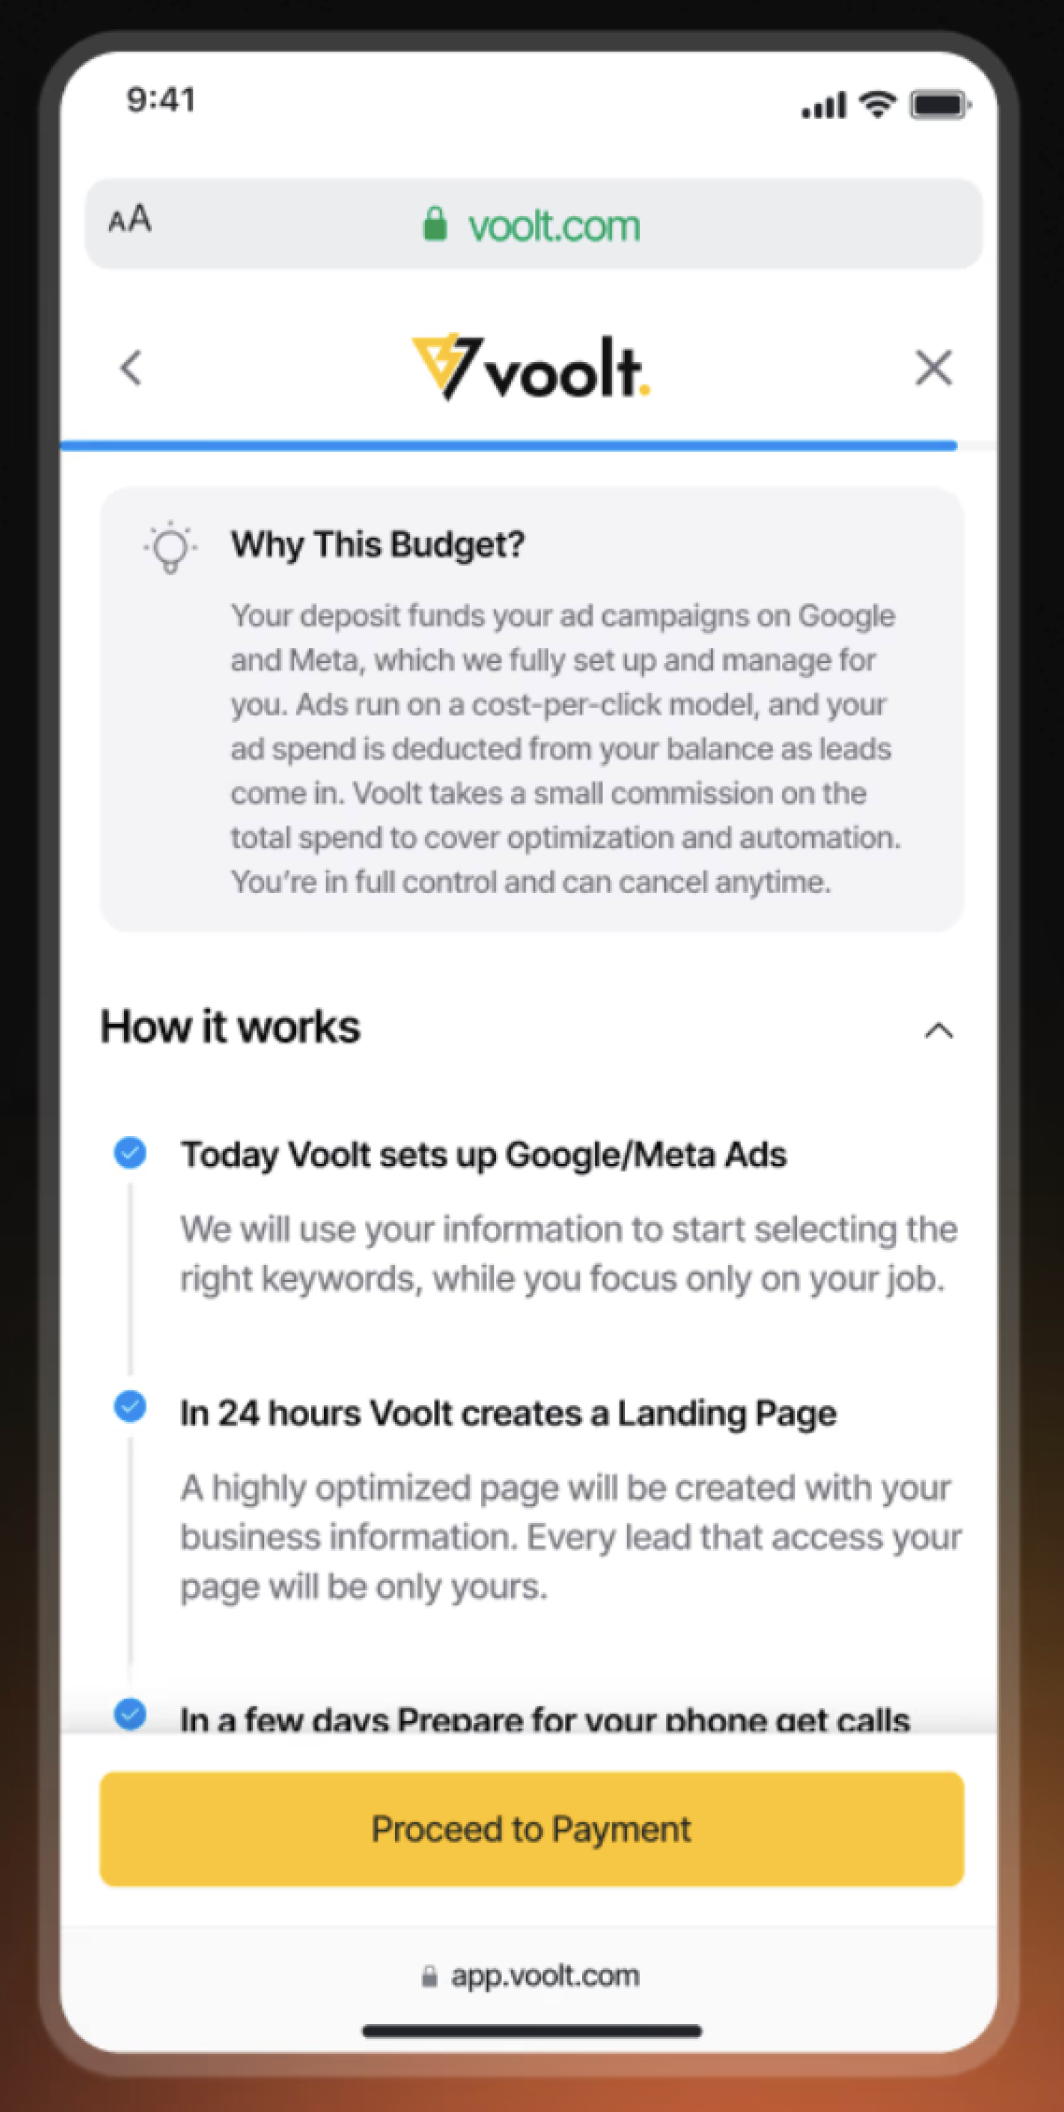
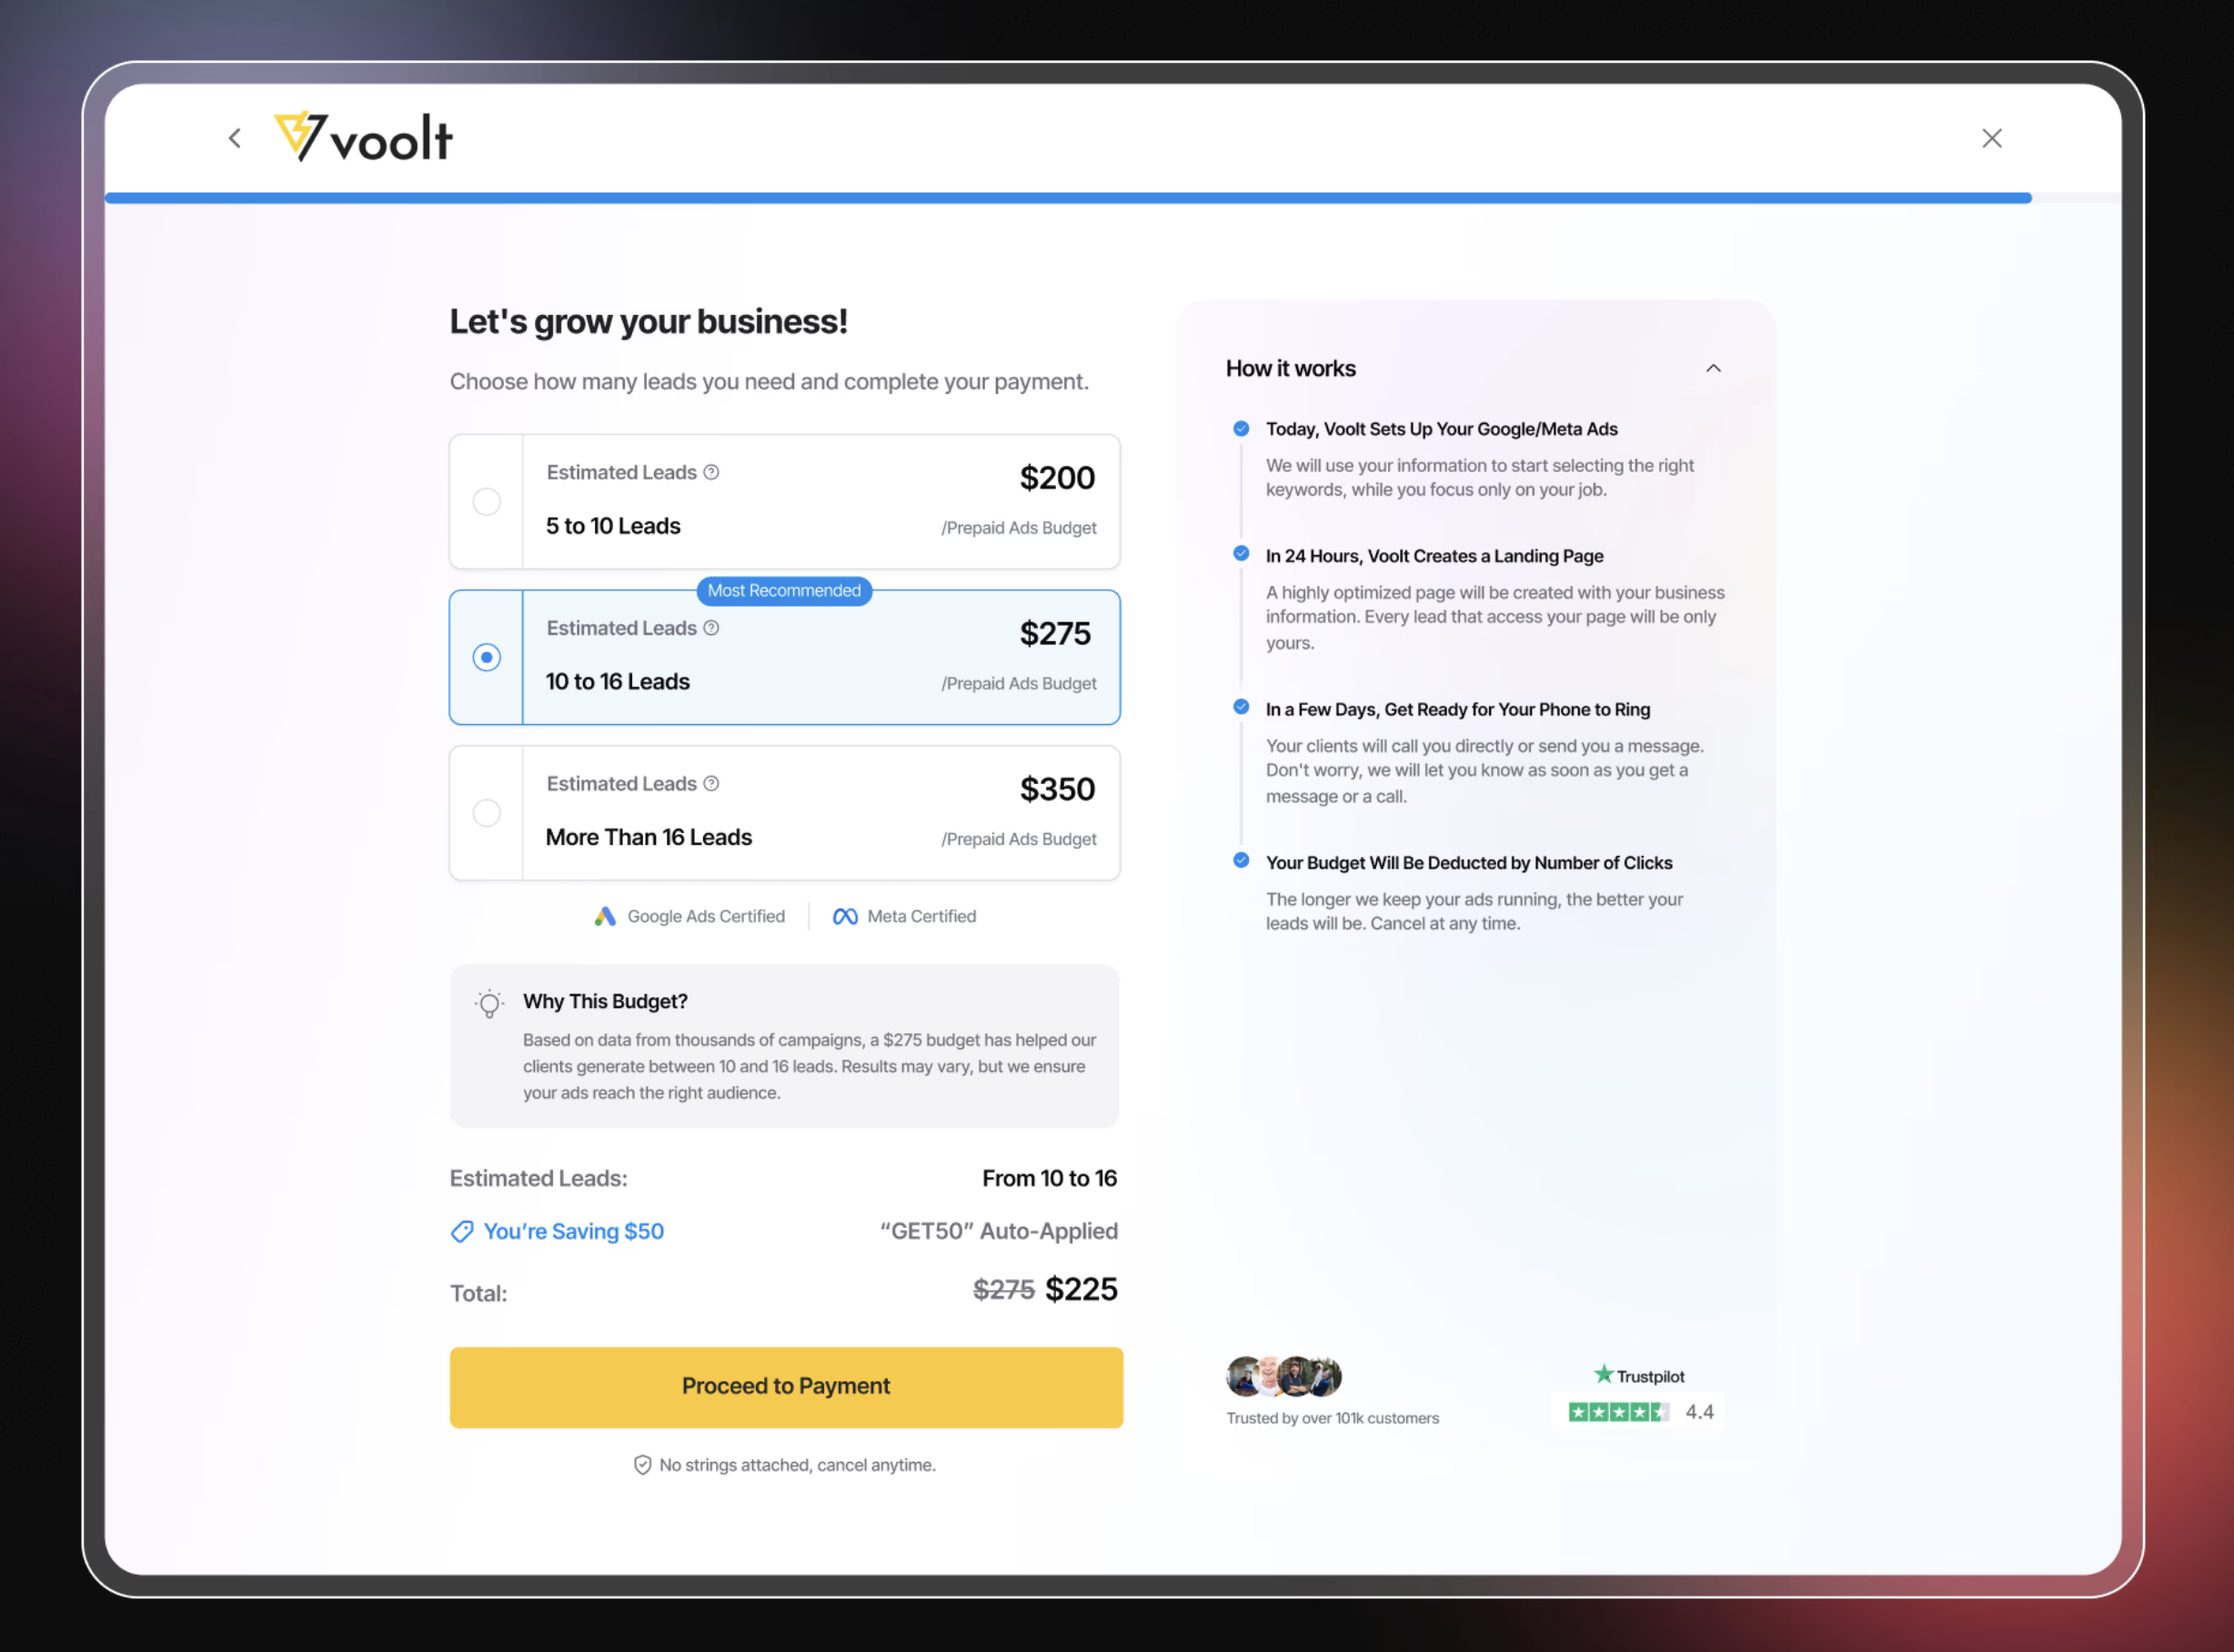
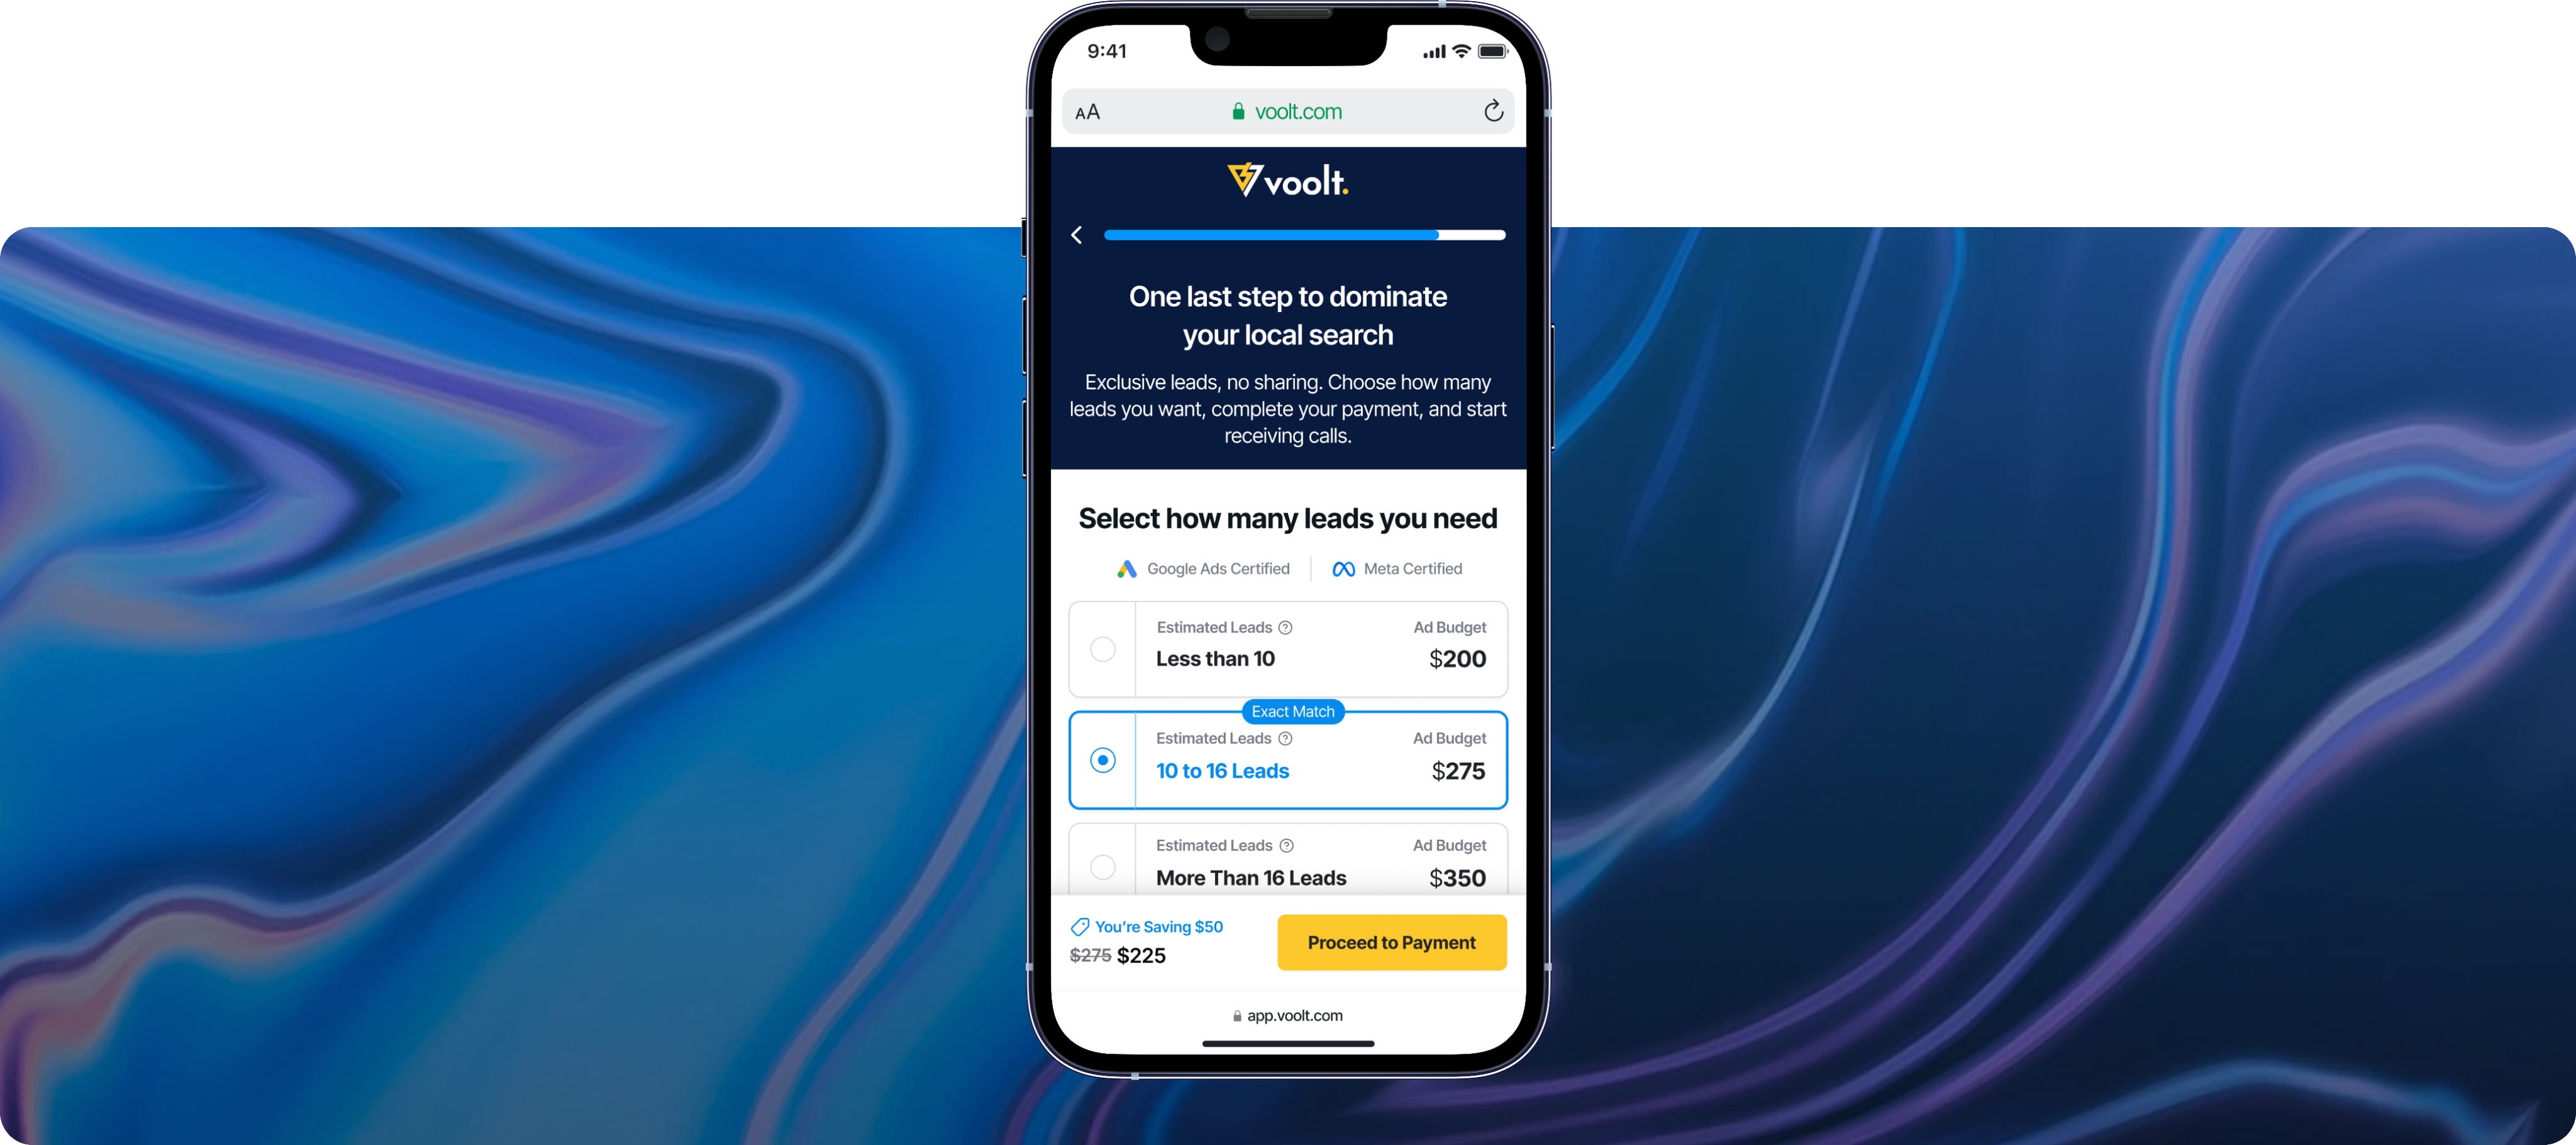
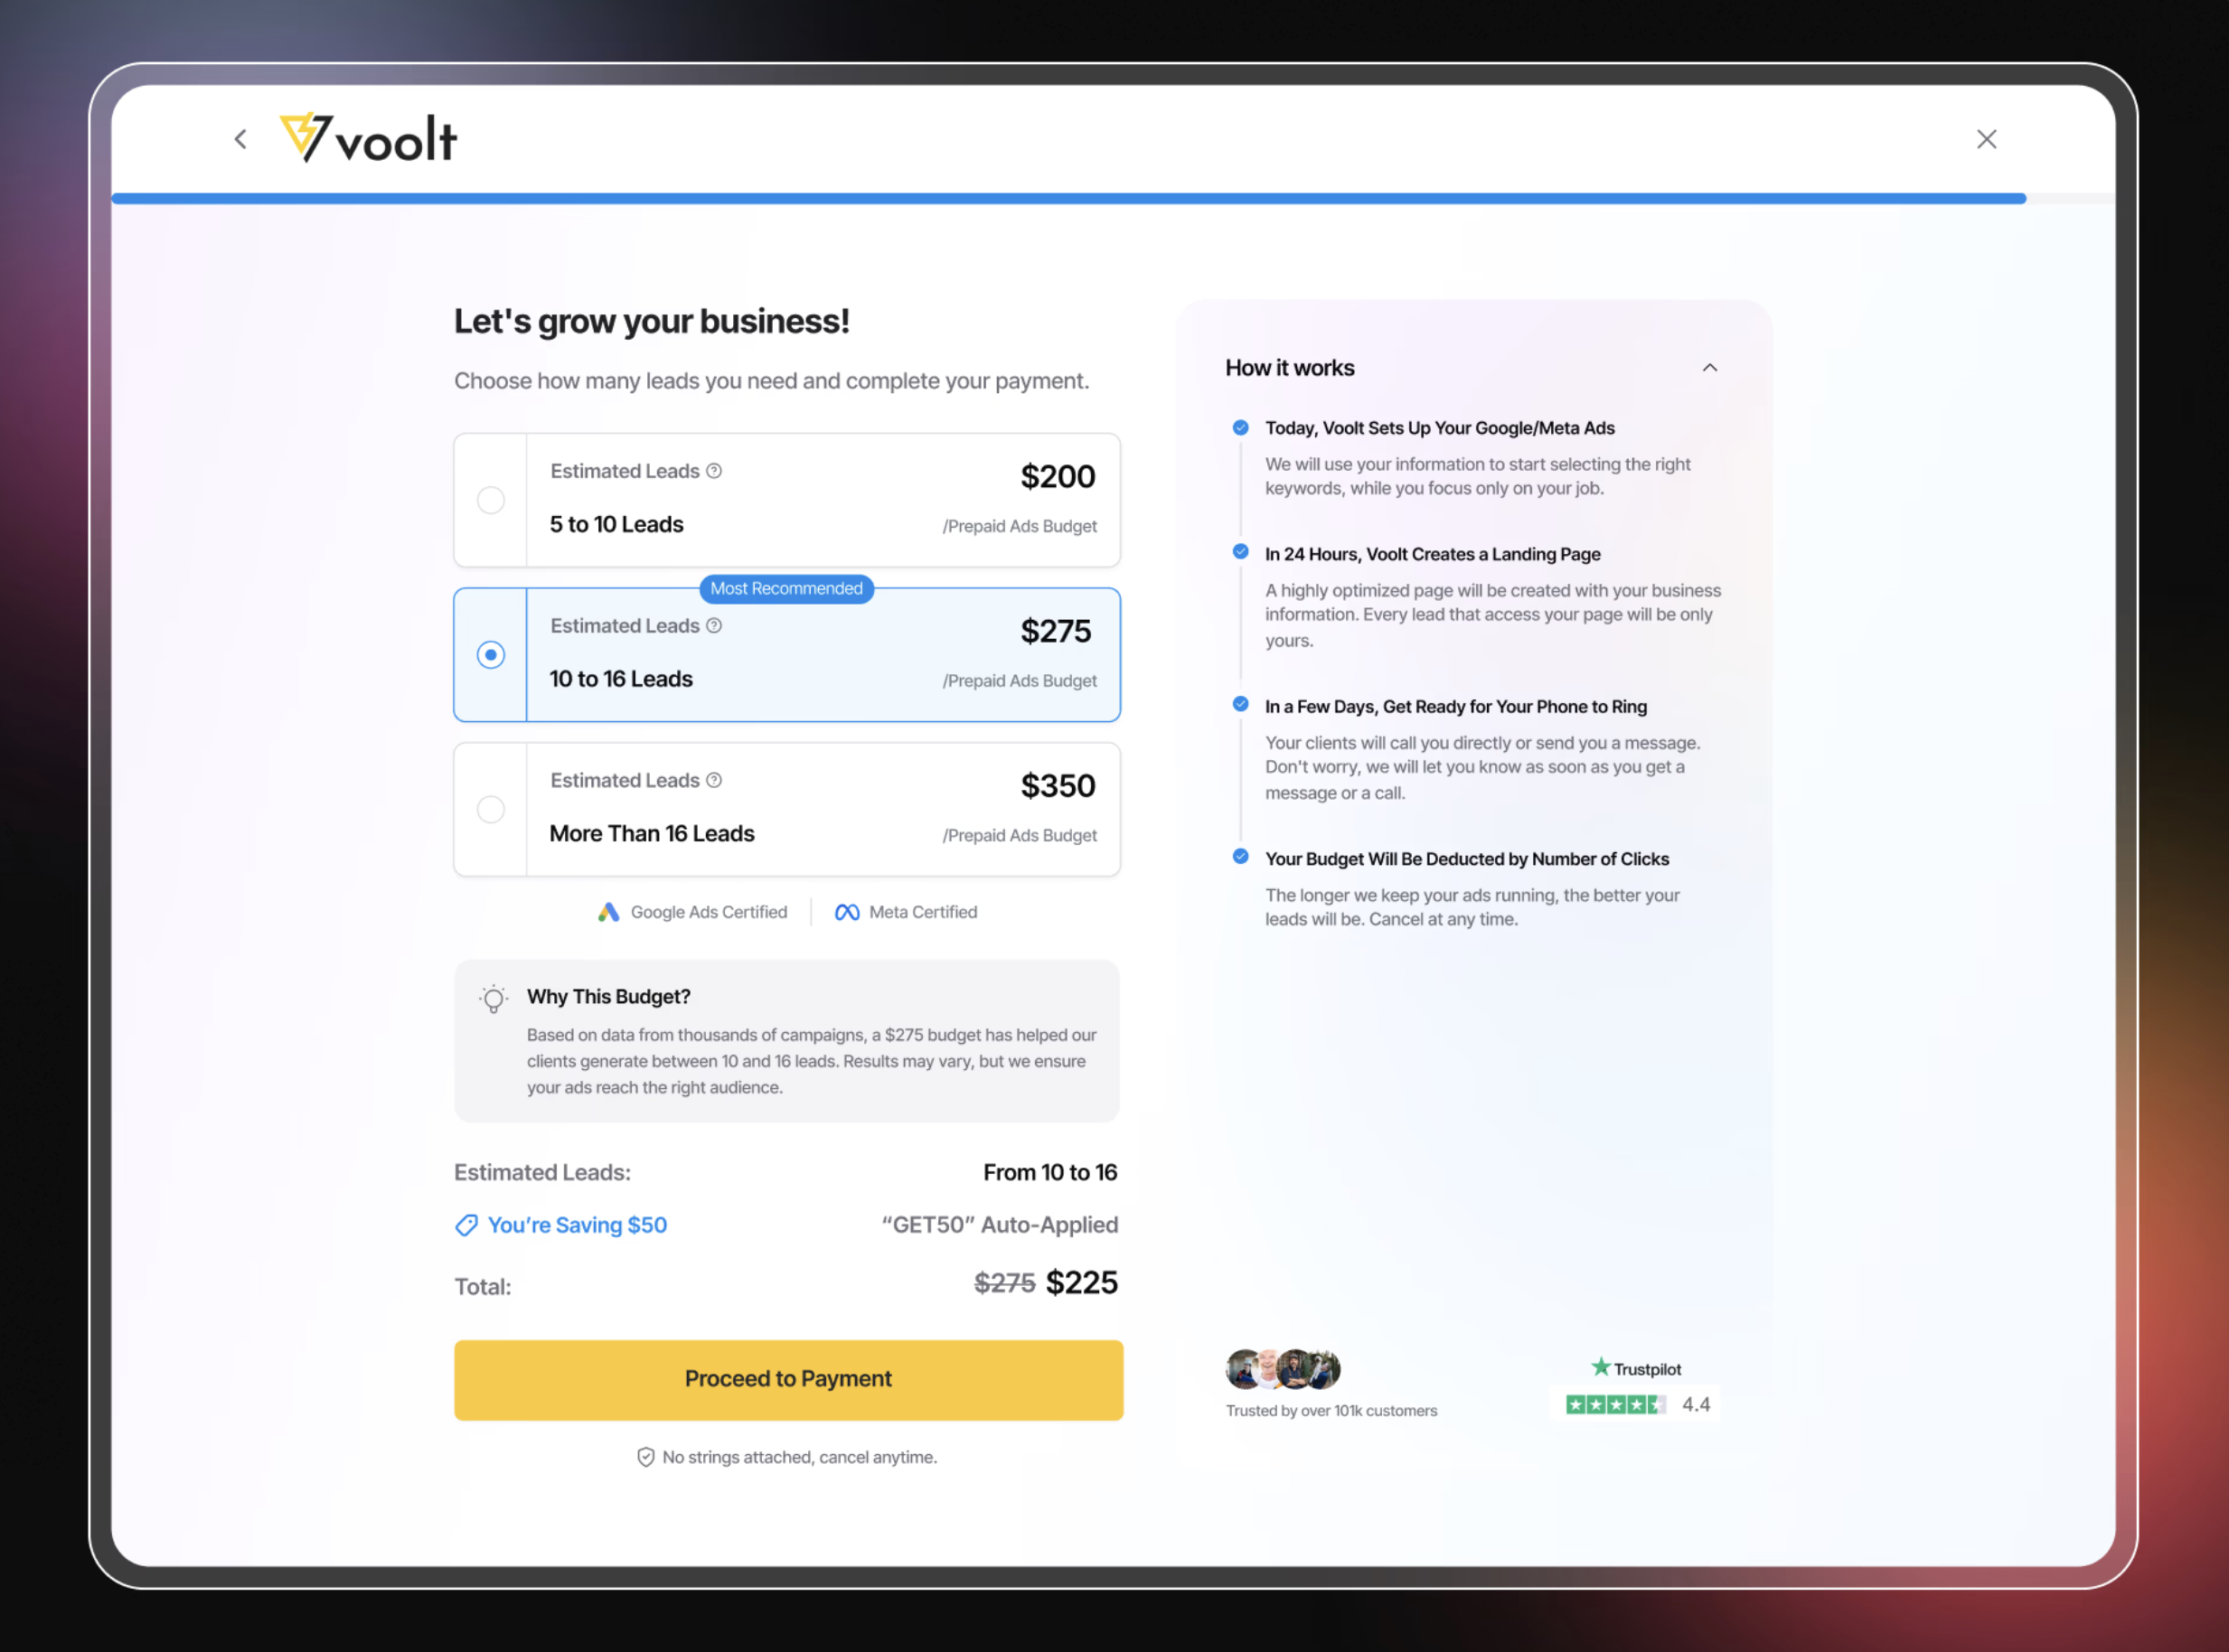
3. Payment Clarity
The deposit screen became a trust-building moment:
- Estimated leads per budget tier
- Visual breakdown of charges
- Why the recommended option performs best
- Cancellation flexibility
The Results: Quality Over Quantity
Three months after the product was launched:
2%
Onboarding completion
Average 288 of 14400 users per month. 8-step journey.
67%
Still active after 30 days
Average 192 of 288 users after 30 days
46%
Still active after 90 days
Average 132 of 288 users after 3 months

2026 | Made via Figma Sites by Leticia Diefenbach
